
Figure 5.
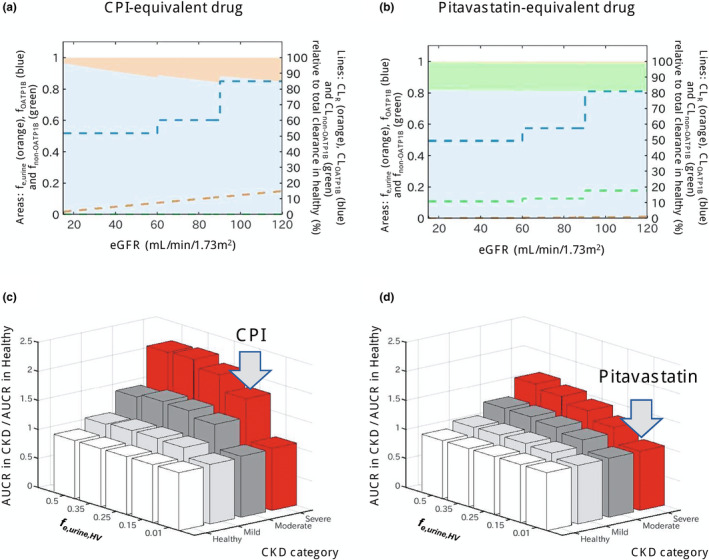
Effect of chronic kidney disease (CKD) on OATP1B‐mediated interactions for drugs with different contributions of hepatic and renal elimination. (a,b) Change in fraction transported of CPI‐equivalent and pitavastatin‐equivalent drugs by OATP1B (f OATP1B , blue area), non‐OATP1B hepatic uptake (f non‐OATP1B , green area), and renal elimination (f e,urine , orange area) derived from CKD‐derived decline in each route. Dashed lines represent clearances via each elimination route (CL OATP1B , CL non‐OATP1B , and CL R ) in different stages of CKD, expressed as relative values to a total clearance in healthy population (label on the right axis). The CPI‐equivalent drug has f e,urine in the healthy population (f e,urine,HV ) of 0.15 and hepatic uptake via OATP1B only (f OATP1B,HV of 0.85). The pitavastatin‐equivalent drug has minimal renal elimination (f e,urine,HV of 0.01) and hepatic uptake via OATP1B (f OATP1B of 0.812, 82% of nonrenal clearance) and non‐OATP1B route (f non‐OATP1B,HV of 0.178, 18% of nonrenal clearance). Simulations were performed assuming that both OATP1B and non‐OATP1B routes contributing to CL active decline to the same extent in CKD and that decrease in CL R is proportional to decline in eGFR (healthy: CL active 100% and CL R 100%; mild CKD: CL active 71% and CL R 75%; moderate CKD: CL active 61% and CL R 50%; severe CKD: CL active 61% and CL R 13%). (c,d) Ratio of AUCR (with/without OATP1B inhibitor) in the population with CKD relative to the healthy population calculated for hypothetical OATP1B drugs with f e,urine,HV ranging from 0.01 to 0.5 and different proportion of non‐OATP1B route to total hepatic uptake clearance (c: none, d: 18%); all assumptions as highlighted above. Gray arrows indicate drugs equivalent to CPI and pitavastatin. Simulations illustrate that presence of non‐OATP1B‐mediated hepatic clearance (assumed to decline in the same manner as OATP1B in CKD) decreases the difference in OATP1B AUCR between CKD and healthy, as the CKD‐derived shift in fraction transported is then not solely attributed to OATP1B. AUCR, ratio of area under the plasma concentration‐time curve; CL active , hepatic uptake clearance; CL R , renal clearance; CPI, coproporphyrin I; eGFR, estimated glomerular filtration rate; OATP1B, organic anion transporting polypeptide 1B.