
Figure 4.
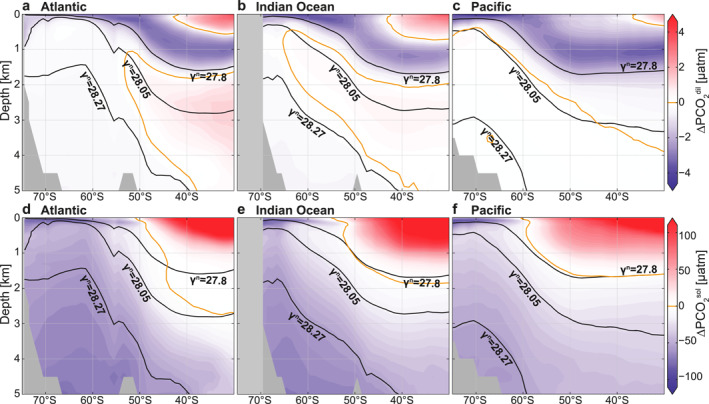
Temperature and salinity effects on the subsurface ∆PCO2 structure. (a–c) Dilution effects () relative to a salinity of 34.7. (d–f) Solubility effects () with respect to a reference temperature and salinity of 2.5°C and 34.7°C, respectively. Panels show the Atlantic (left), Indian (middle), and Pacific (right) sectors of the Southern Ocean. Isoneutral surfaces are shown in black, and the 0 μatm ∆PCO2 isoline in orange.