
Figure 5.
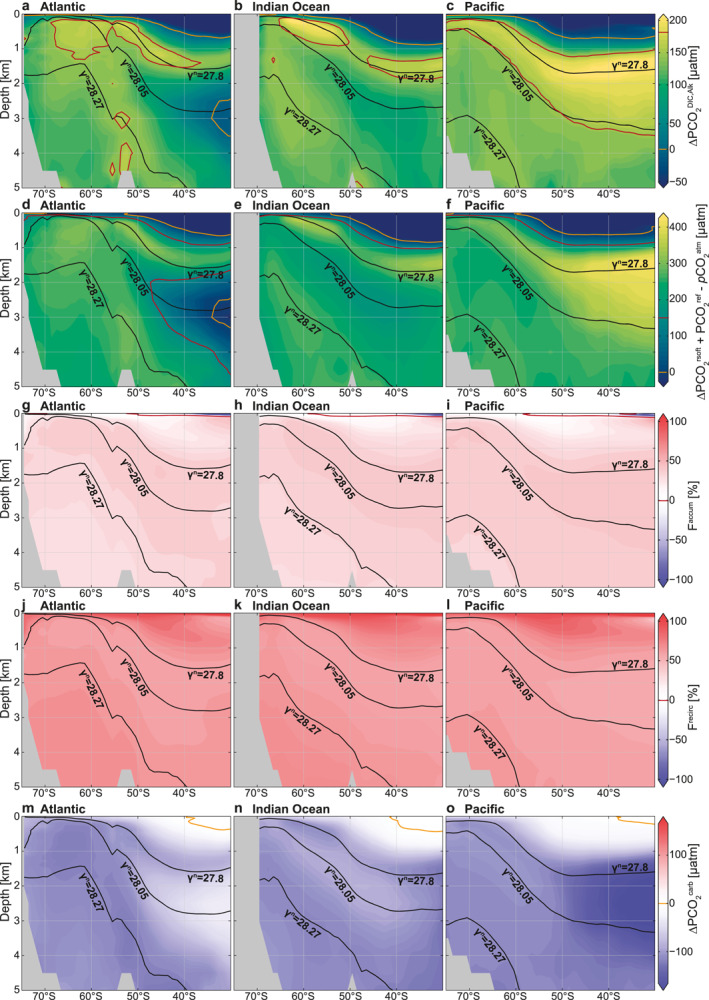
Biological drivers of the subsurface ∆PCO2 structure. (a–c) ∆PCO2 structure due to interior ocean dissolved inorganic carbon (DIC) and Alk variations alone (), after removing dilution and solubility effects. (d–f) Expected ∆PCO2 driven by the retained soft‐tissue pump () due to photosynthesis and remineralization of organic matter plus (131 μatm) minus (400 μatm). (g–i) Fraction of the retained soft‐tissue pump associated with accumulated remineralized carbon in the deep ocean (Faccum). (j–l) Fraction of the retained soft‐tissue pump recirculated remineralized carbon (Frecirc). (m–o) Carbonate pump () due to precipitation and dissolution of calcium carbonate. Panels show the Atlantic (left), Indian (middle), and Pacific (right) sectors of the Southern Ocean. Isoneutral surfaces are shown in black, and the 150 and 0 μatm ∆PCO2 isolines in red and orange, respectively.