
Figure 6.
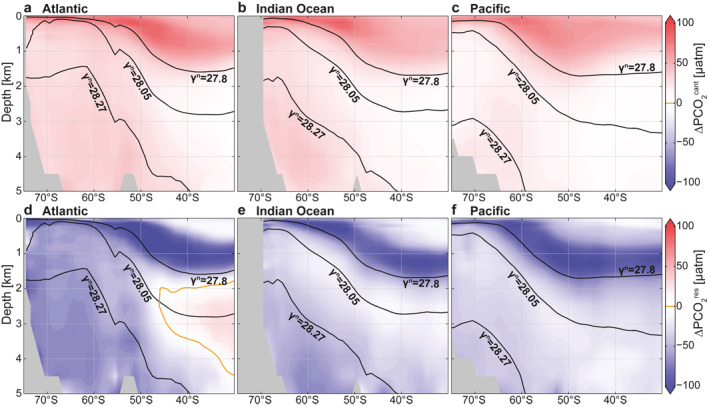
Ventilation effects on the subsurface ∆PCO2 structure. (a–c) Influence of anthropogenic carbon uptake (). (d–f) Influence of air‐sea gas exchange due to equilibration and other residual effects (). Panels show the Atlantic (left), Indian (middle), and Pacific (right) sectors of the Southern Ocean. Isoneutral surfaces are shown in black, and the 0 μatm ∆PCO2 isoline in orange.