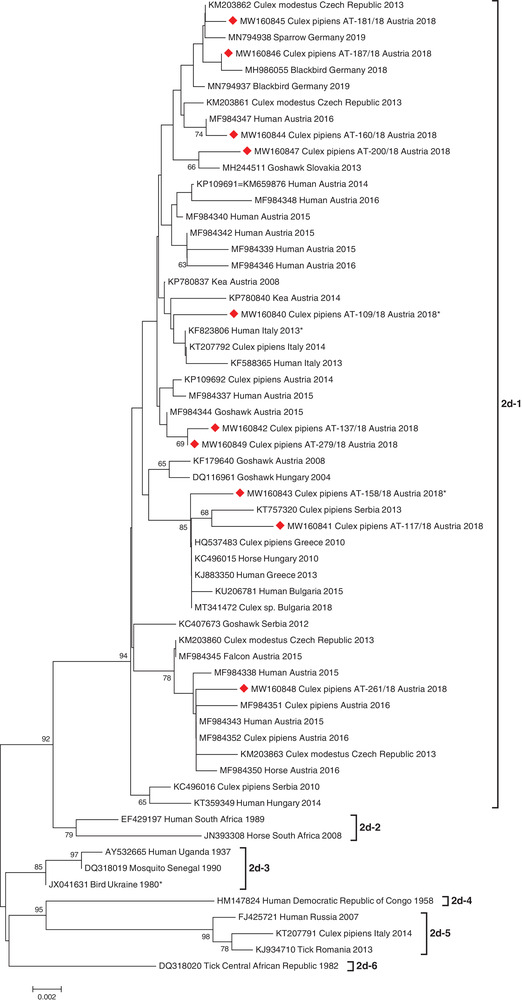
FIGURE 2.

Phylogenetic tree demonstrating the genetic relationships among 60 WNV lineage 2 sequences. The 10 sequences generated in this study are indicated by red diamonds. Asterisks indicate sequences exhibiting deletions within the 3′UTR. Phylogenetic analysis was performed on 690‐bp long sequences within the NS5/3′UTR genomic region (positions 10147–10976 according to the WNV complete genome sequence, GenBank acc. no. DQ116961). For each sequence, the corresponding GenBank accession number, host species, country of origin, and collection year are indicated. Horizontal lines represent the genetic distances. Genetic sub‐lineages are indicated by vertical bars on the right. Bootstrap values above 60 are displayed at the nodes.
