
FIG 1.
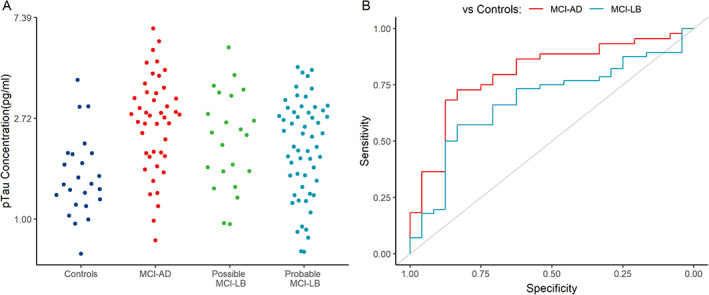
(A) Raw plasma pTau181 measurements in each diagnostic group at baseline; (B) ROC (receiver operating characteristic) curves for the differentiation of MCI‐AD and MCI‐LB from healthy controls. AD, Alzheimer's disease; LB, Lewy bodies; MCI, mild cognitive impairment. [Color figure can be viewed at wileyonlinelibrary.com]