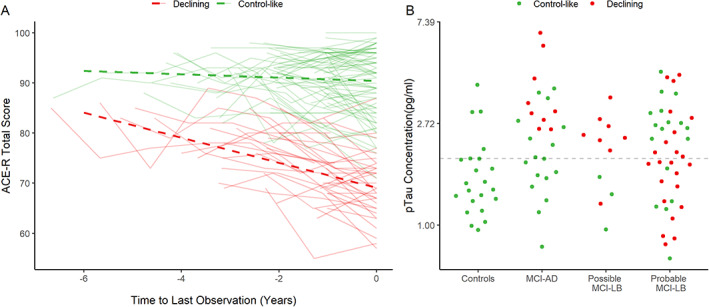
FIG 2.

Latent trajectories of cognitive function, centered on the last observation: (A) with adjusted estimated trajectories for each class and (B) raw pTau181 concentrations for each diagnostic group, stratified by latent trajectory; dashed line indicates a cutoff of 1.929 pg/mL pTau181. [Color figure can be viewed at wileyonlinelibrary.com]
