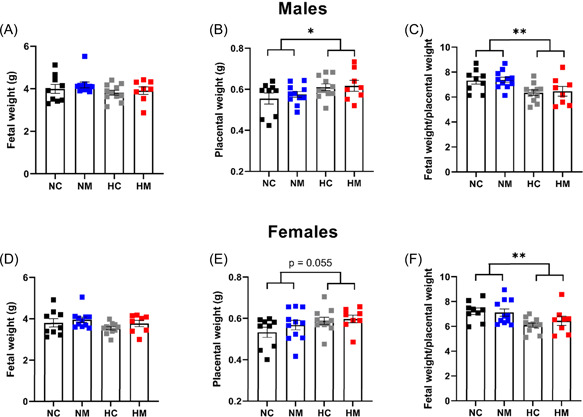
Figure 3.

Fetal parameters at GD 20. Fetal weight and placental weight were measured for male fetuses (A–C) and female fetuses (D–F) at GD 20. Data points represent litter averages. n = 134 pups from 9 litters (NC), 145 pups from 11 litters (NM), 150 pups from 11 litters (HC), 115 and pups from 8 litters (HM). *p< .05, **p< .01 to represent significant effects of hypoxia. Significance was assessed using a two‐way ANOVA. Error bars show mean ± SEM. ANOVA, analysis of variance; GD, gestational day; HC, hypoxia control; HM, hypoxia melatonin; NC, normoxia control; NM, normoxia melatonin.
