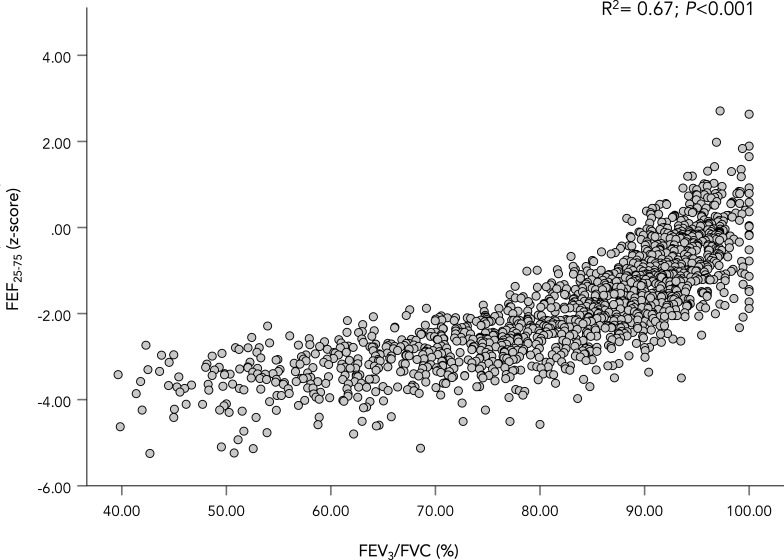
Figure 6.
FEV3/FVC plotted against FEF25-75 z-score. A scatter plot showing the relationship between FEF25-75 z-score and FEV3/FVC. The coefficient of determination (r2) for the WLS regression is shown in the figure along with its p value. FEF25-75, forced expiratory flow between 25% and 75% of vital capacity; FEV1, forced expired volume in 1 s; FVC, forced vital capacity; WLS, weight-least square.

