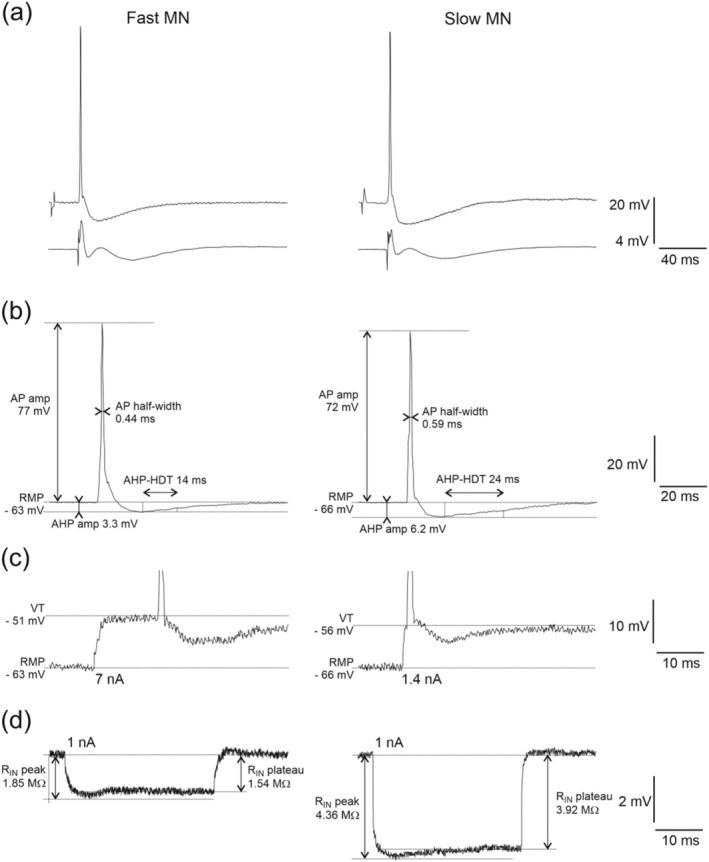
FIGURE 1.

Examples of recordings from a fast MN (left column) and slow MN (right column). (a) Antidromic action potentials evoked by stimulation of the tibial nerve recorded intracellularly (upper traces), and incoming volleys recorded from the surface of the spinal cord at the dorsal root entry zone (lower traces). (b) Orthodromic action potentials evoked by intracellular stimulation with indicated measured parameter (AHPamp, afterhyperpolarisation amplitude; AHP–HDT, afterhyperpolarisation half‐decay time; AP half‐width, action potential half‐width; APamp, action potential amplitude). (c) Expanded voltage traces of the rheobase spikes evoked with the intracellular current injection of 7 nA (for fast MN) or 1.4 nA (for slow MN). Horizontal lines indicate the resting membrane potential (RMP) and spike voltage threshold (VT) for each example. (d) Responses to the intracellular injection of 1 nA hyperpolarising current pulse for calculation of peak input resistance (RIN peak) and plateau input resistance (RIN plateau)
