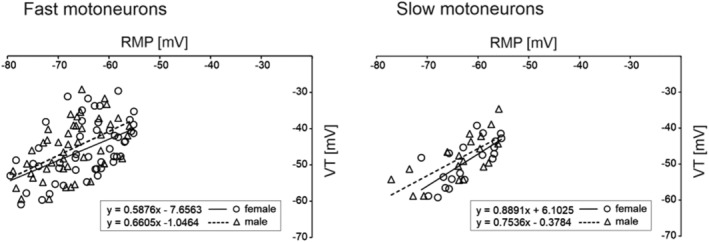
FIGURE 4.

Correlations between resting membrane potential (RMP) and voltage threshold (VT) for fast MNs (left) and slow MNs (right). The regression lines were determined separately for female and male MNs, according to the equations provided in each plot. For each pair of correlations, the slopes of the regression lines are similar for female and male MNs (p = 0.78 and p = 0.84, respectively, an equal‐slope test)
