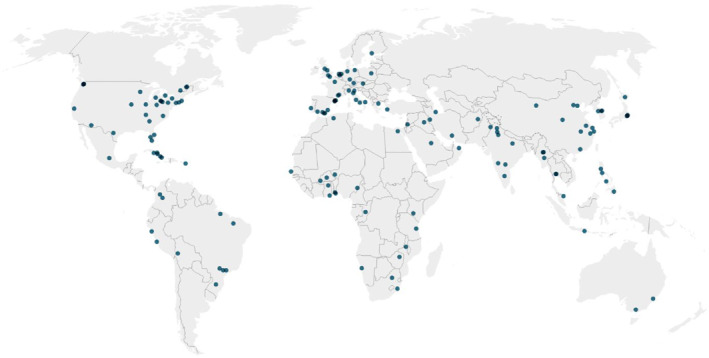
Figure 2.

Global distribution of the cities and towns where urban agriculture was conducted in our data set. Each dot represents a city or town where field experiments took place. The color of the dots does not reflect the number of field experiments coming from each city or town; darker colors are a consequence of dots overlapping when several cities or towns are too close to each other.
