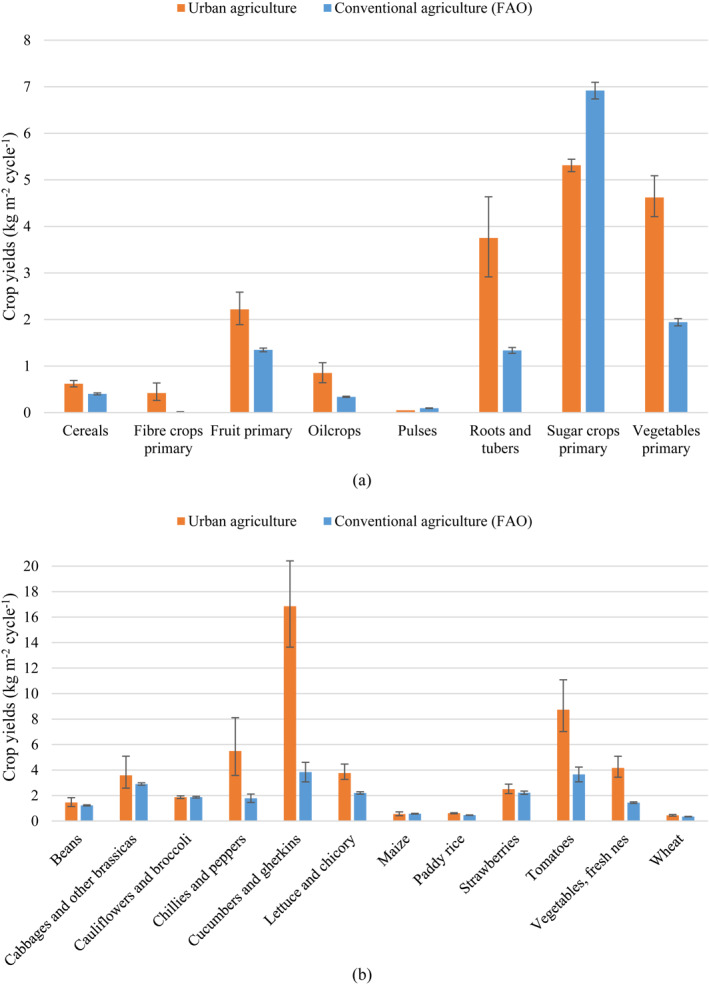
Figure 3.

Mean crop yields per growing cycle of urban agriculture (data from this meta‐analysis) and mean global crop yields of conventional agriculture for the years 2015–2020 from FAOSTAT (FAO, 2022) for the aggregated (a) and disaggregated (b) crop categories. “Pulses” was not included in the analysis since only one observation was found for this crop category. Only disaggregated crop categories with a number of observations greater than 50 are shown. Bars represent non‐weighted mean yield values. Error bars correspond to the 95% confidence intervals.
