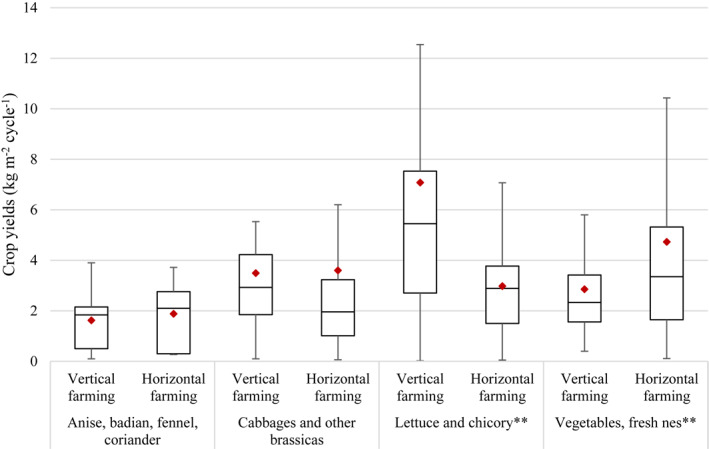
Figure 5.

Differences in crop yields per growing cycle between urban systems using vertical farming and urban systems using horizontal farming for four disaggregated categories of crops. For vertical farming, crop yields correspond to the total weight of crops from all the different growing layers stacked together per square meter of ground area. Boxplots represent the first quartile (bottom end of the box), the median (band inside the box) and the third quartile (top end of the box). Error bars represent the minimum and maximum values of crop yields within the 1.5 interquartile range of the lower and upper quartiles, respectively. Red diamonds show the mean. ** = p < 0.01 (independent two‐sample t‐test).
