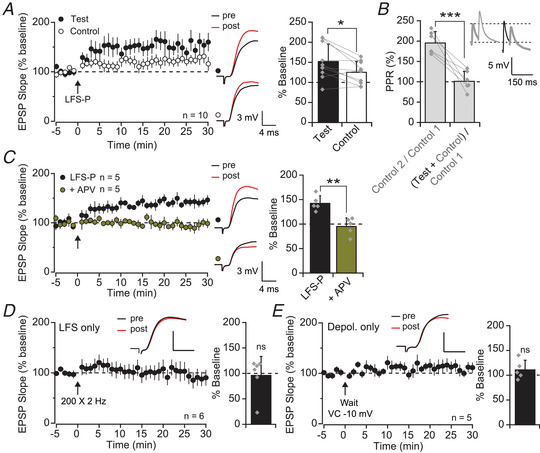
Figure 2. Pairing‐induced LTP is Hebbian and NMDA receptor‐dependent.

A, LFS‐P‐induced LTP was relatively pathway‐specific, quantified on right (P = 0.018). B, pathway independence was verified by comparing the paired‐pulse ratio (PPR) across and within pathways (P < 0.0001). Inset shows example traces in response to stimulation of the control (grey) or test (black) pathways; responses indicated by the thick lines should be equivalent if pathways are fully independent. C, perfusion of APV (100 μM) blocked the induction of LTP by LFS‐P (P = 0.002). D, pooled dataset and representative traces showing no LTP in SLM interneurons following presynaptic LFS only (P = 0.831; scale bars: 2.5 mV, 5 ms). E, as for D but for postsynaptic depolarisation only (P = 0.257; scale bars: 4 mV, 5 ms). [Colour figure can be viewed at wileyonlinelibrary.com]
