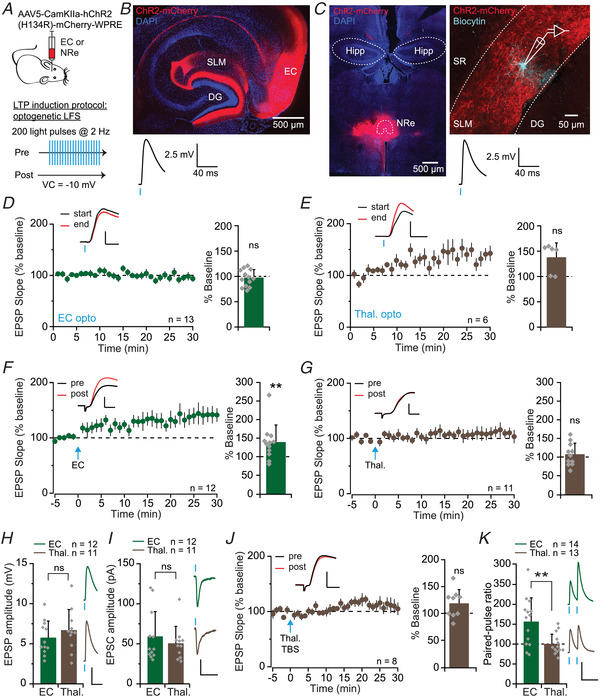
Figure 4. LTP induction by stimulation of entorhinal cortex but not thalamic inputs to SLM interneurons.

A, top: schematic diagram showing viral strategy used to target the nucleus reuniens (NRe) of the thalamus or the entorhinal cortex (EC); bottom: schematic diagram of the optogenetic low‐frequency stimulation‐pairing (LFS‐P) protocol. B, confocal image of a horizontal brain section (70 μm) showing viral expression (red) at the injection site in the EC, as well as in perforant path axons in the SLM region of hippocampal CA1 and molecular layer of the dentate gyrus (DG), and DAPI staining (blue). Below: example light‐induced EPSP recorded from an SLM interneuron in a mouse injected in the EC (average 15 traces). C, confocal images of a coronal brain section (70 μm) showing viral expression (red) at the injection site in the thalamus including the NRe, and DAPI staining (blue; left), and a sagittal hippocampal slice (300 μm) showing a biocytin‐filled SLM interneuron (cyan) surrounded by transduced thalamic afferents (red; right). Below: example light‐induced EPSP recorded from the same cell (average 15 traces). DG, dentate gyrus; Hipp., hippocampus, SR, stratum radiatum. D, optogenetic stimulation of EC afferents evoked EPSPs in SLM interneurons that remained stable over a 30 min recording period, quantified on right (P = 0.536; scale bars: 1 mV, 5 ms). E, as for D but showing run‐up of optogenetically evoked thalamic responses in SLM interneurons (P = 0.077; scale bars: 3 mV, 4 ms). F, optogenetic LFS‐P of EC afferents induced LTP, quantified on right (P = 0.003; scale bars: 3 mV, 4 ms). G, the same optogenetic stimulation protocol applied to thalamic afferents did not induce LTP (P = 0.671; scale bars: 3 mV, 4 ms). H, optogenetic stimulation of EC or thalamic afferents evoked EPSPs of similar amplitude, recorded during the baseline period of LTP experiments (average of 15 traces; P = 0.370; scale bars: 2.5 mV, 40 ms). I, EPSCs recorded during the optogenetic LFS‐P LTP induction protocol (average of 200 traces) were of similar amplitude for both sets of afferents (P = 0.644; scale bars: 25 pA, 40 ms). J, a theta‐burst stimulation (TBS) protocol applied to thalamic afferents also failed to induce LTP (P = 0.122; scale bars: 2.5 mV, 5 ms). K, paired‐pulse facilitation (PPF) was induced by optogenetic paired‐pulse stimulation of EC but not thalamic axons (right: averages of five traces) (P = 0.0005; scale bars: 5 mV, 100 ms). [Colour figure can be viewed at wileyonlinelibrary.com]
