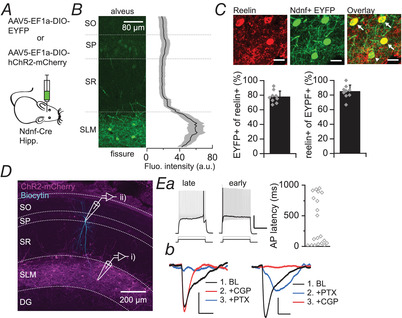
Figure 5. Hippocampal NDNF+ cells are NGF cells.

A, schematic diagram showing viral strategy used to express EYFP or ChR2‐mCherry in hippocampal NDNF+ cells. Hipp., hippocampus. B, left, confocal image of a section of CA1 used to measure NDNF+‐EYFP fluorescence intensity across hippocampal layers. Right, mean (black) ± SEM (grey) fluorescence intensity across hippocampal layers (n = 6 slices, four mice), normalised to percentage distance from the alveus to the hippocampal fissure. SO, stratum oriens; SP, stratum pyramidale; SR, stratum radiatum. C, close‐up of the SLM showing reelin immunostaining (top left), EYFP+ NDNF cells (top centre) and overlay (top right; scale bar: 20 μm). White arrows indicate reelin‐positive NDNF cells and arrowhead shows one reelin‐negative NDNF cell. Percentage overlap was quantified in nine slices from three mice (bottom). D, confocal image of a sagittal hippocampal slice (300 μm) showing selective expression in SLM neurons (magenta), and a biocytin‐filled pyramidal cell (cyan) in stratum pyramidale. DG, dentate gyrus. E, electrophysiological properties of NDNF+ cells and projections to pyramidal neurons. Ea, mCherry‐tagged NDNF+ cells showed late‐ or early‐spiking properties in response to a near‐rheobase current step (black; quantified on right, n = 20), and sustained spiking in response to a double‐rheobase current step (grey; scale bars: 25 mV, 500 ms). Eb, optogenetic stimulation of NDNF+ cells induced long‐lasting inhibitory postsynaptic potentials (IPSPs) in pyramidal cells at baseline (BL) (black) that were abolished by blockers of GABAA (blue; PTX: picrotoxin, 100 μM) and GABAB (red; CGP: CGP 55845, 1 μM) receptors (scale bars: 1 mV, 125 ms). [Colour figure can be viewed at wileyonlinelibrary.com]
