
Figure 7. LTP of SLM interneurons alters excitation–inhibition balance in the temporoammonic pathway.
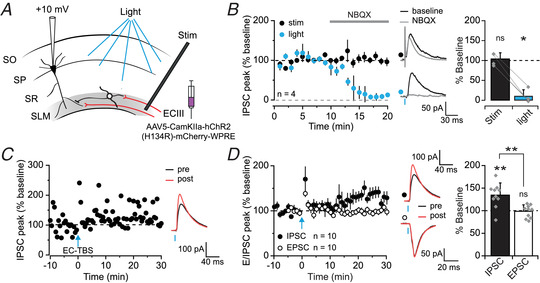
A, experimental set‐up for recording disynaptic IPSCs from CA1 pyramidal cells elicited by electrical stimulation of the SLM (stim) or optogenetic stimulation of EC afferents (light). SO, stratum oriens; SP, stratum pyramidale; SR, stratum radiatum. B, effect of NBQX (10 μM) on IPSCs elicited by alternate electrical and optogenetic stimulation. Reduction of IPSCs by NBQX quantified on right (stim: P = 0.834; light: P = 0.050). C, representative experiment and traces showing LTP of feedforward inhibition induced by optogenetic TBS of EC afferents (EC‐TBS). D, pooled dataset showing EC‐TBS‐induced LTP of disynaptic IPSCs (black; P = 0.002), but not of monosynaptic EPSCs (white; P = 0.982), with representative traces (IPSCs same as in panel D) (group comparison: P = 0.001). [Colour figure can be viewed at wileyonlinelibrary.com]