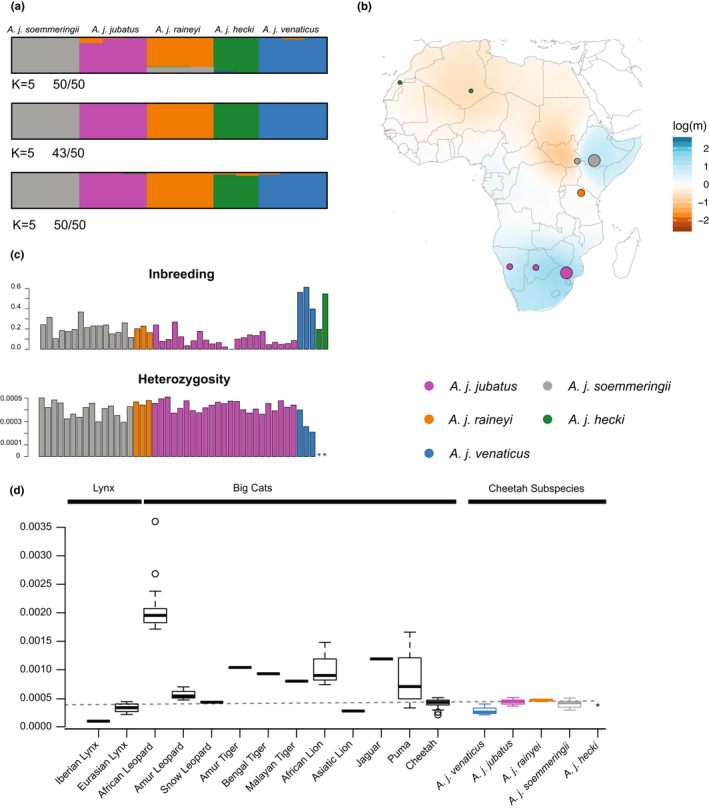
FIGURE 3.

Population genetic analyses of cheetahs using genome‐wide SNP data. (a) Admixture analyses for K = 5 for the three different sample subsets using the 3743 SNP data. Numbers indicate how many individual runs of the 50 replicates support this grouping. (b) Effective migration rates between the African cheetah subspecies. Blue and brown colours reflect below‐ and above‐the‐average migration rates, respectively. The dots represent approximate sample locations (exact locations were not available) and their size is proportional to the number of samples from this region. (c) Inbreeding coefficients based on the 3743 SNPs and heterozygosity based on genome‐wide data indicating high inbreeding in individuals of A. j. Venaticus and A. j. hecki and low heterozygosity in individuals of A. j. Venaticus. **Indicates that individuals of A. j. Hecki were not included in the heterozygosity analysis. (d) Genome‐wide heterozygosity data for big cats, two lynx species, and five cheetah subspecies. All values apart from the cheetah estimates were obtained from Pečnerová et al. (2021). *Indicates that individuals of A. j. Hecki were not included in the heterozygosity analysis. The dashed line indicates the average value for the cheetah as a species.
