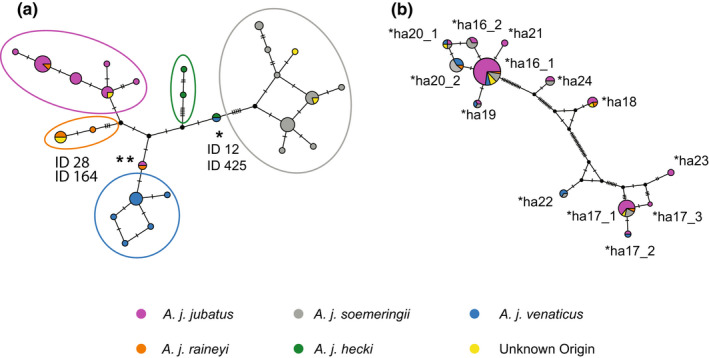
FIGURE 4.

Haplotype analyses of (a) mitochondrial DNA data, and (b) MHC. II DRB exon 2 data. (a) Median‐joining haplotype network reconstruction based on 929 bp of mitochondrial DNA from 58 individuals. We circled the nominal haplogroups in the colours to which subspecies they can be assigned to. We marked the placement of the individual from India (ID 425) and the individual from Chad (ID 12) with an asterisk, and the individual from Tanzania (ID28) and the individual from Zimbabwe (ID164) with two asterisks. (b) Median‐joining network of the nucleotide sequences of the MHC II DRB exon 2.
