
FIGURE 6.
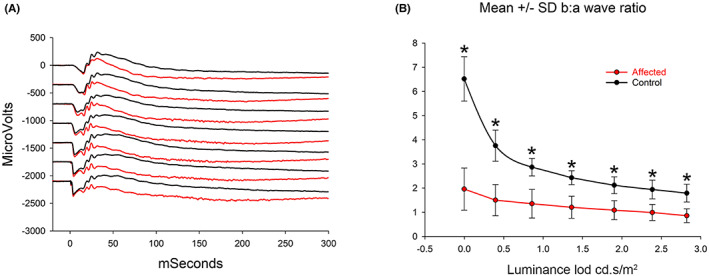
Dark‐adapted ERG luminance series A. Superimposed ERG tracing from an affected (red) and normal control (black) dog (dogs IV.D and IV.L). Note that although the a‐wave amplitudes are very similar the b‐wave of the affected dog is reduced in amplitude. Luminance of the flashes shown: 0, 0.4, 0.9, 1.4, 1.9, 2.3, and 2.8 log cd.s/m2. B. The mean (±SD) dark‐adapted b:a‐wave ratios from control (n = 10) and NRE (red) dogs (n = 5) at 1 year of age (*p < .01 unpaired t‐test)