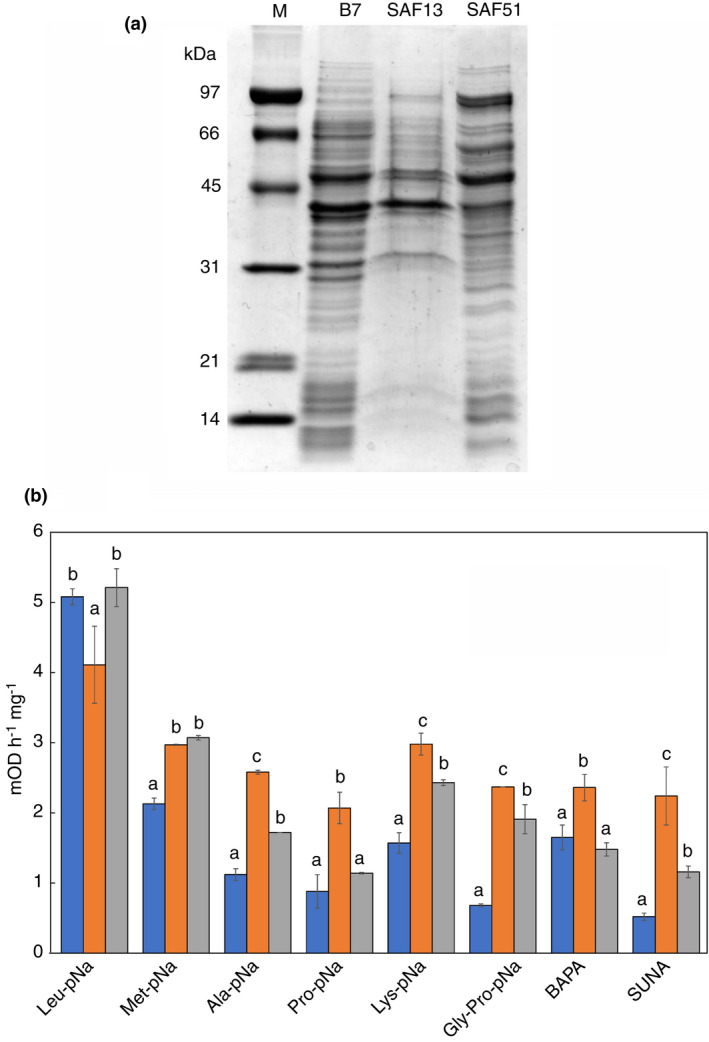
FIGURE 3.

Proteasic activity of cell lysates. A: SDS‐PAGE of the cell lysate of L. plantarum B7, L. fabifermentans SAF13 and F. rossiae SAF51; for each sample 5 μg of protein were loaded. B: Proteolytic activity of strains F. rossiae SAF51 ( ), L. fabifermentans SAF13 (
 ) and L. plantarum B7 (
 ) expressed in mOD h−1 mg−1. Different letters indicate significant differences (p < 0.05).
