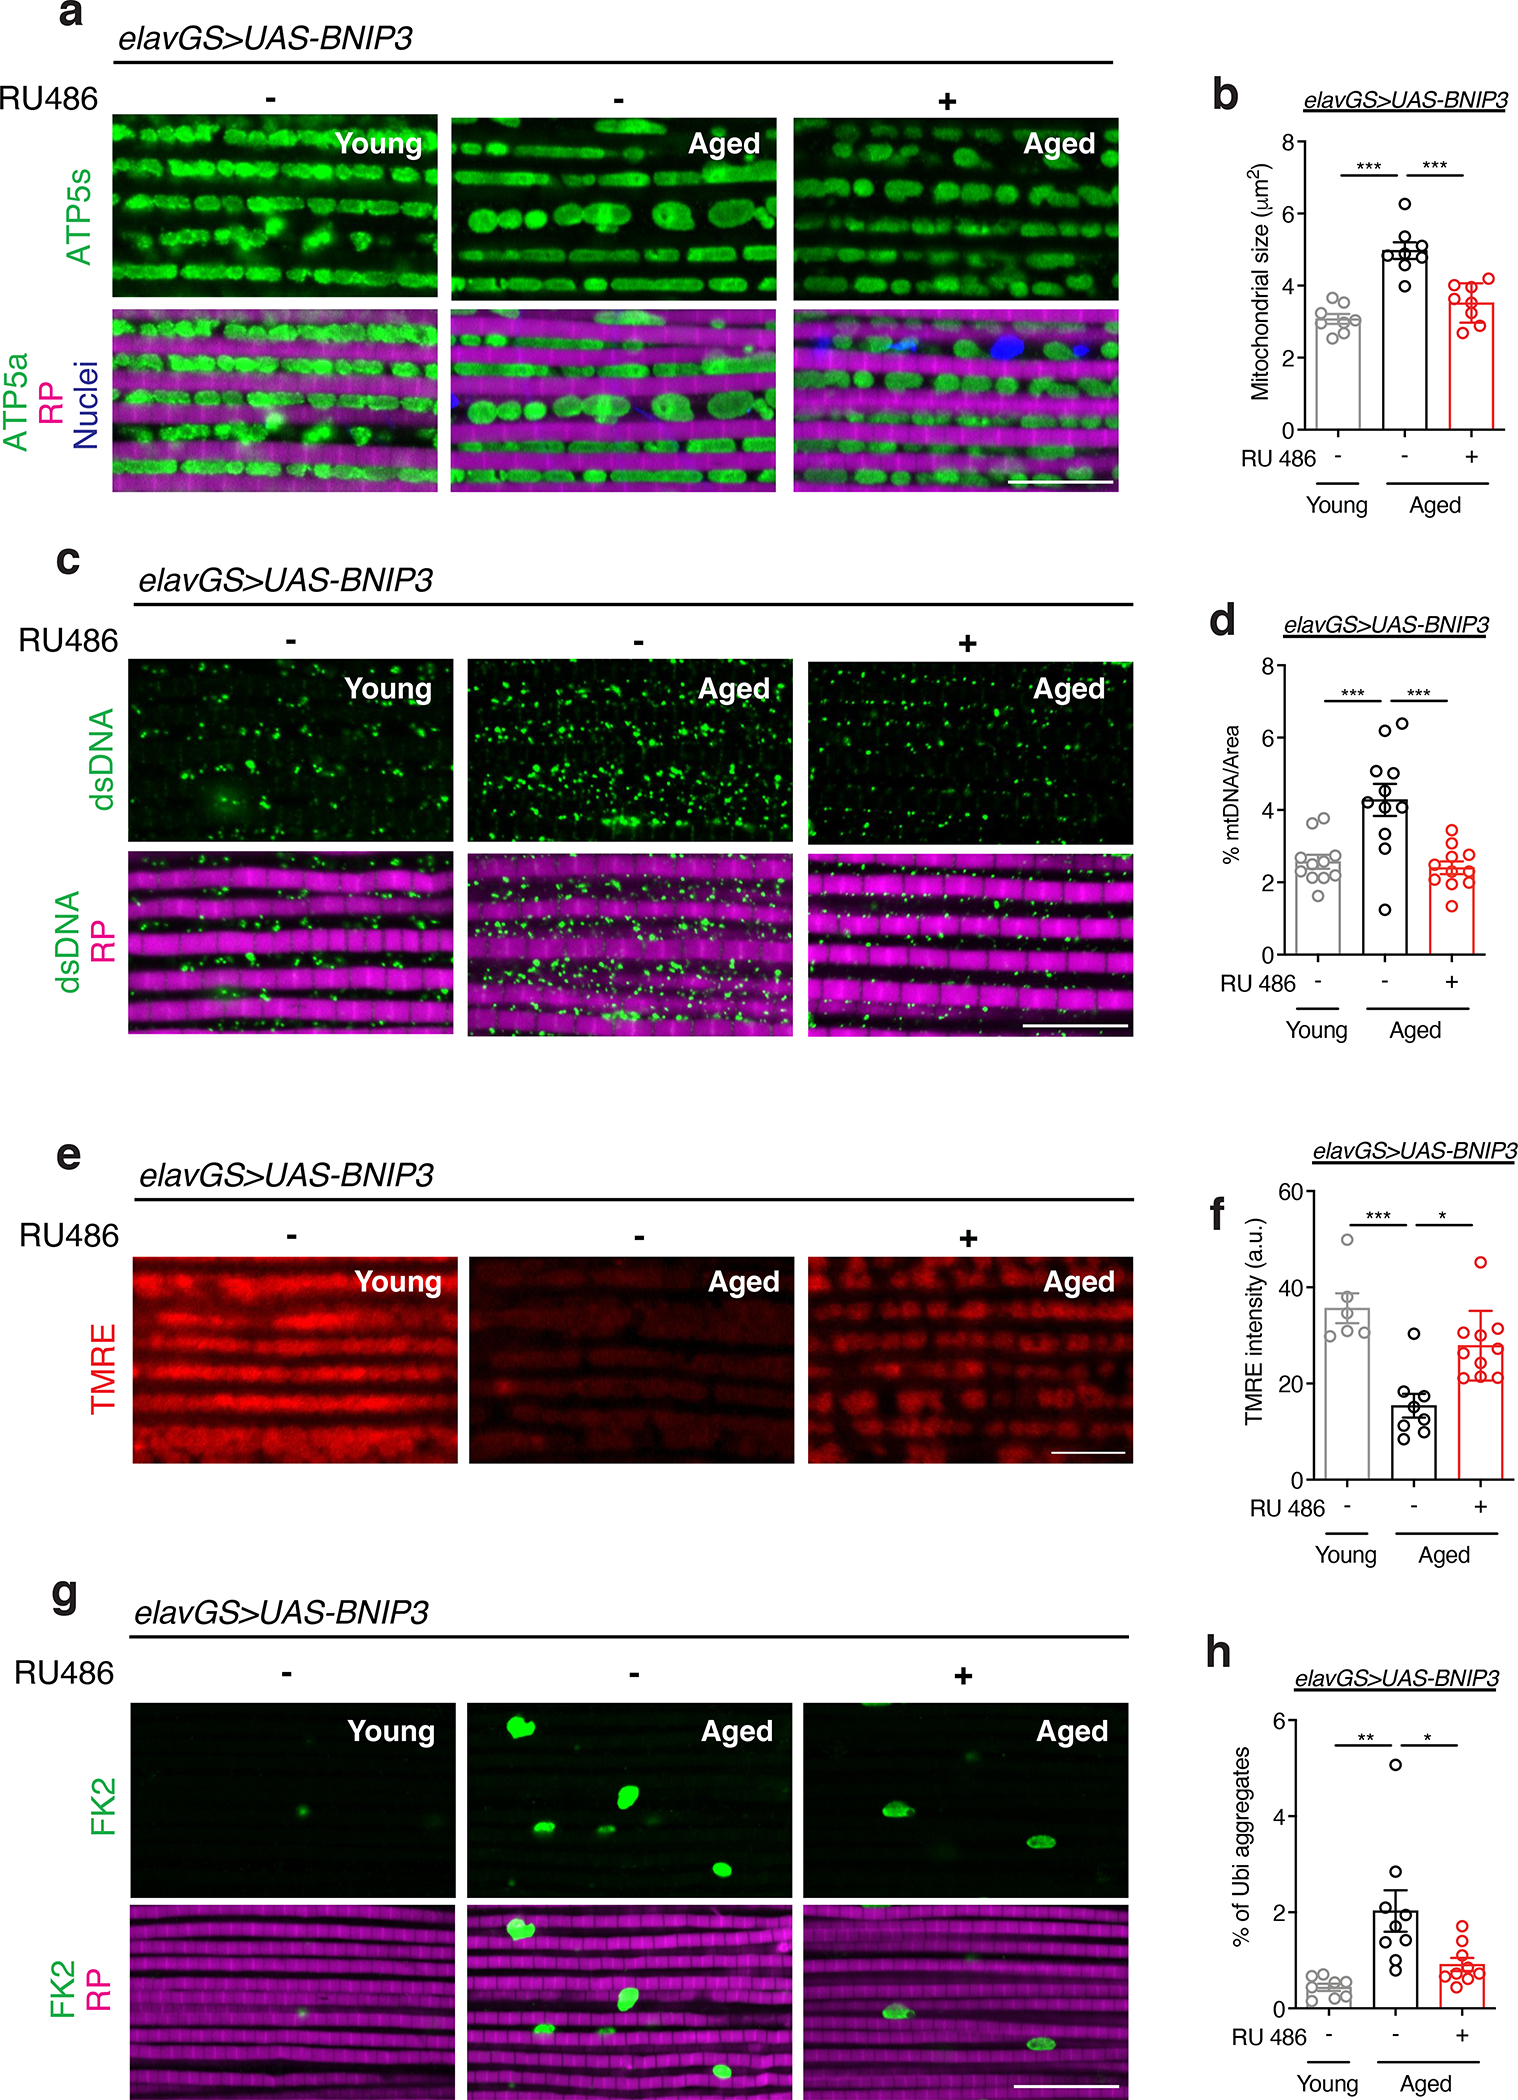
Figure 4. Neuronal BNIP3 induction improves mitochondrial homeostasis and proteostasis in aged muscle.

(a) Immunostaining of indirect flight muscles from young (10-day-old) and aged (30-day-old) elavGS>UAS-BNIP3 flies with or without RU486-mediated transgene induction from day 5 onward, showing mitochondrial morphology (green channel, anti-ATP5a), rhodamine phalloidin (RP, magenta channel), and nuclear DNA (blue channel, stained with DAPI). Scale bar is 10 μm.
(b) Quantification of mitochondrial size in muscle as shown in (a). n = 8 biologically independent animals per condition. ***p<0.0001; one-way ANOVA/Tukey’s multiple comparisons test.
(c) Immunostaining of indirect flight muscles from young (10-day-old) and aged (30-day-old) elavGS>UAS-BNIP3 flies with or without RU486-mediated transgene induction from day 5 onward, showing mitochondrial DNA (green channel, anti-dsDNA) and rhodamine phalloidin (magenta channel). Scale bar is 10 μm.
(d) Quantification of mitochondrial DNA in muscle as shown in (c). n =11 biologically independent animals per condition. ***p=0.0009 (young vs. aged RU−), ***p=0.0003 (aged RU− vs. aged RU+); one-way ANOVA/Tukey’s multiple comparisons test.
(e) Staining of indirect flight muscles from young (10-day-old) and aged (30-day-old) elavGS>UAS-BNIP3 flies with or without RU486-mediated transgene induction from day 5 onward, showing TMRE fluorescence. Scale bar is 10 μm. (f) Quantification of mitochondrial membrane potential measured by TMRE staining as shown in (e). n = 6 young, 8 aged RU−, and 10 aged RU+ biologically independent animals, as indicated. *p=0.0400, ***p=0.0006; Kruskal-Wallis test/Dunn’s multiple comparisons test.
(g) Immunostaining of indirect flight muscles from young (10-day-old) and aged (30-day-old) elavGS>UAS-BNIP3 flies with or without RU486-mediated transgene induction from day 5 onward, showing polyubiquitinated aggregates (green channel, anti-FK2) and rhodamine phalloidin (magenta channel). Scale bar is 10 μm.
(h) Quantification of polyubiquitin aggregates in muscle as shown in (g). n = 8 young, 9 aged RU−, and 9 aged RU+ biologically independent animals, as indicated. *p=0.0204, **p=0.0014; one-way ANOVA/Tukey’s multiple comparisons test. RU486 or vehicle was provided in the media at a concentration of 5 μg/ml in the indicated treatment groups. Data are presented as scatter plots overlaying mean values +/− SEM.
