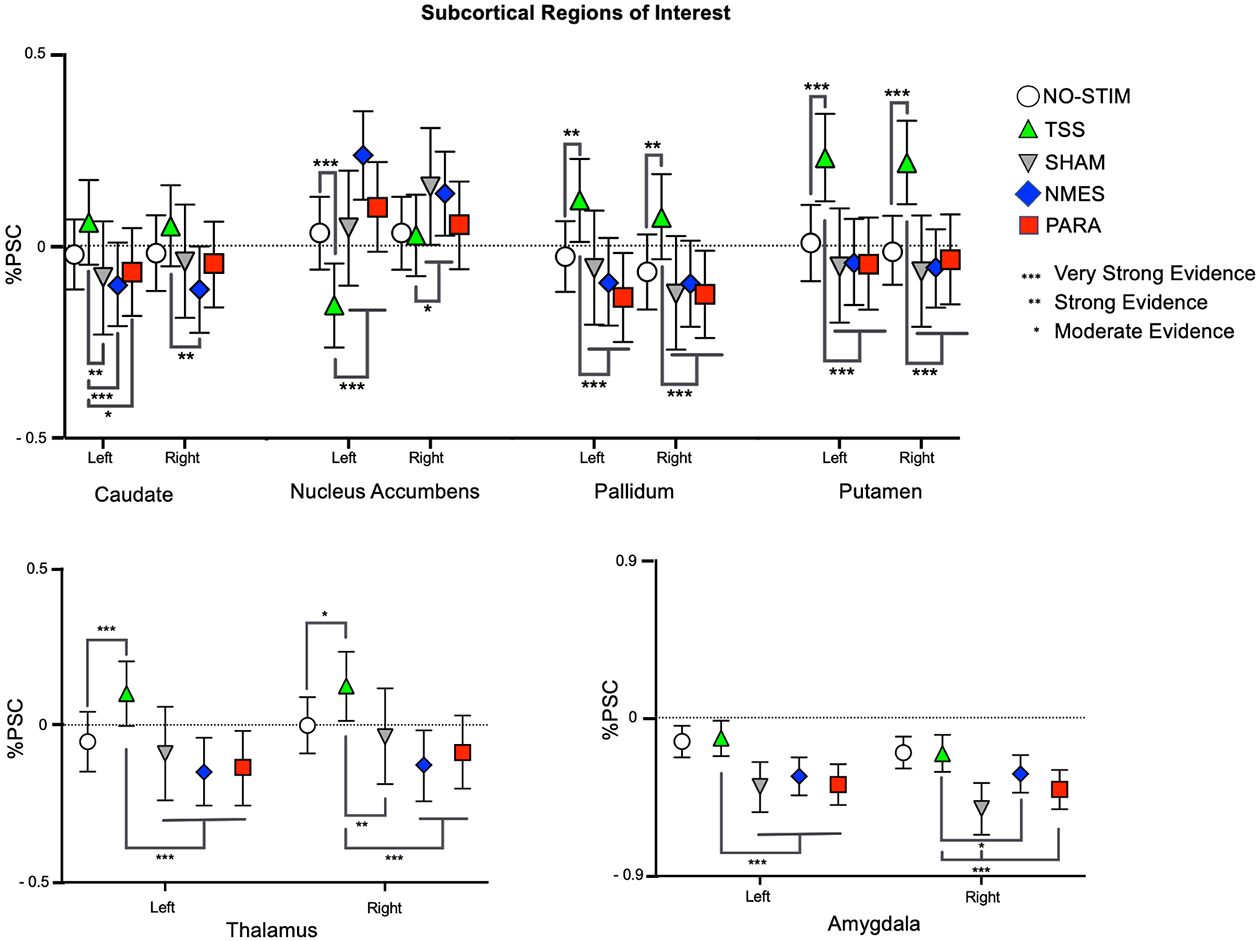
Figure 4:

Patterns of activation and deactivation in subcortical ROIs. BOLD signal changes are plotted as mean percent signal change (%PSC) from baseline for each condition. The strength of differences outputted by the BML for the comparisons between NO-STIM and TSS are indicated by the asterixis above the lines, whereas the asterixis below the lines indicate the strength of the differences between TSS and the NMES, PARA, and SHAM. Error bars indicate 95% confidence interval.
