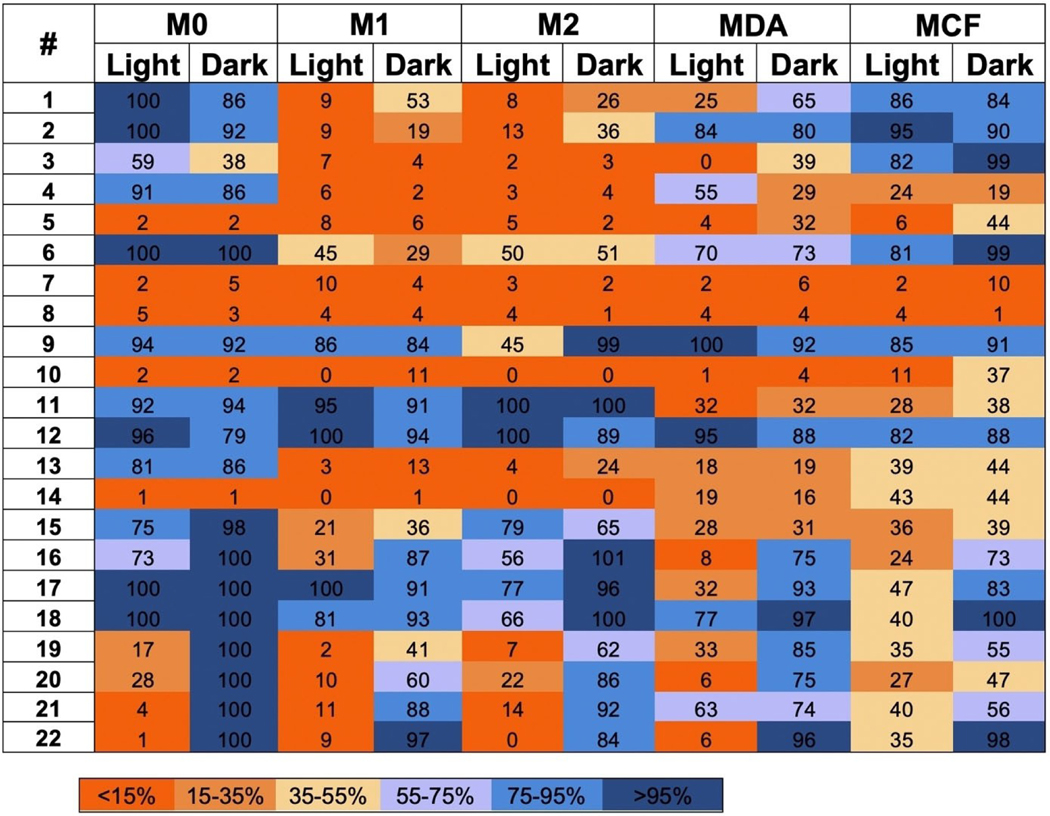
Figure 2.
Heat map for light and dark cell viabilities of 5 cell lines treated with compounds 1–22. Cells were treated with compound 1–22 (10 μM) and either irradiated (λirr=460–470 nm, tirr=20 min, 56 J/cm2) or left in the dark. Cells were incubated for 72 h before viabilities were evaluated by MTT assay. Values in Figure 2 are represented as % viability vs. vehicle control with the same cell type. Values range from low viabilities (<15 %: bright orange) to high viability (>95 %: dark blue). Light alone did not decrease viability vs. non-irradiated controls. Viability data are averages from quadruplicate wells. Data are representative from three independent experiments. MDA: MDA-MB-231; MCF: MCF-10 A.

