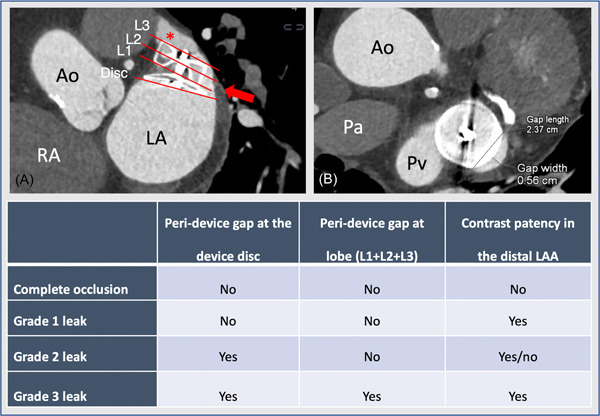
Figure 1.

Peridevice leak sizing and categorization by cardiac computed tomography. Illustration of the assessment of PDL by cardiac CT. (A) Illustrates the assessment of peridevice leak at the disc (Disc), proximal (L1), mid (L2), and distal (L3) cross‐sectional view of the device. (B) A cross‐sectional view of the device, with measurement of peridevice leak width and length. The table illustrates the categorization of PDL severity. Ao, ascending aorta; CT, computed tomography; LA, left atrium; Pa, pulmonary artery; PDL, peridevice leak; Pv, left upper pulmonary vein; RA, right atrium [Color figure can be viewed at wileyonlinelibrary.com]
