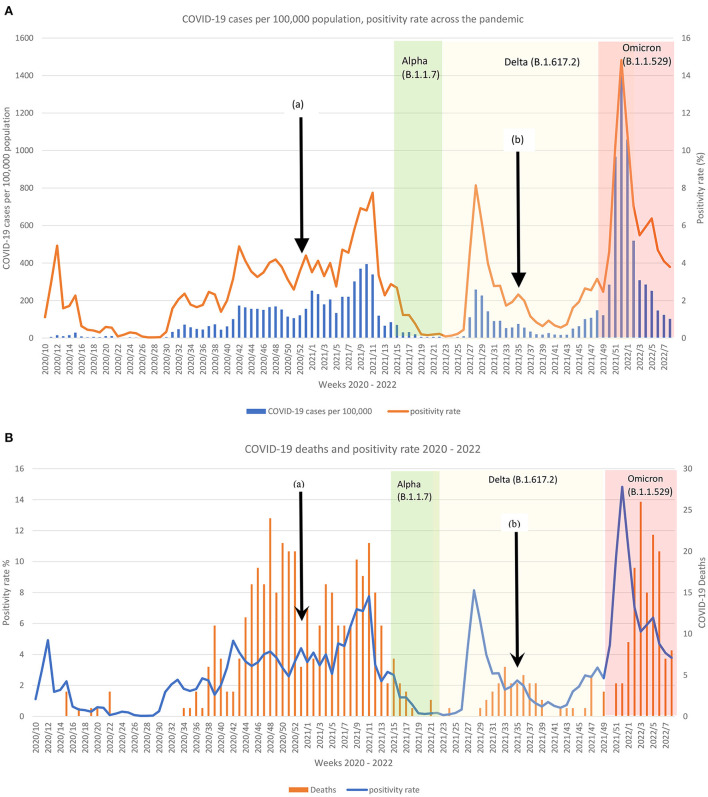
Figure 1.
Comparison of the reported (A) COVID-19 cases per 100,000 and positivity rate per week and (B) COVID-19 deaths and positivity rate per week according to the dominating variant across 2 years in Malta. Black arrow (a) indicates start of COVID-19 vaccination and (b) start of booster dose. White background = original SARS-CoV2; Green background = Alpha variant; Yellow background = Delta variant; Red background = Omicron variant.

