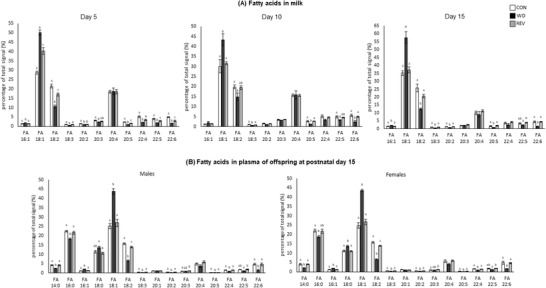
Figure 5.

Percentage of total signal of free fatty acids in the milk of CON‐, WD‐, and REV‐dams at lactation days 5, 10, and 15 a), and in the plasma of their male and female offspring at postnatal day 15 b). Data are mean ± SEM (n = 6–8). Statistics: one‐way ANOVA followed by Bonferroni post‐hoc test was performed to determine differences between groups. Symbols: a ≠ b ≠ c (p < 0.05). ANOVA, analysis of variance; CON, control; REV, reversion; SEM, standard error of the mean; WD, western diet.
