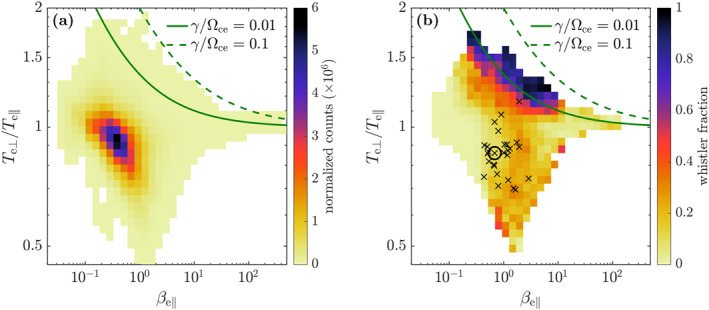
Figure 3.

(a) Distribution of β e‖ and T e⊥/T e‖ (counts scaled with bin size). (b) Fraction of data points where whistler waves are observed. The green curves show the whistler instability threshold (Equation 1) for growth rates γ/Ω ce = 0.01 (solid) and 0.10 (dashed). Black crosses indicate when the butterfly‐shaped electron distribution was observed simultaneously with whistler waves. The circle marks the example in Figure 2.
