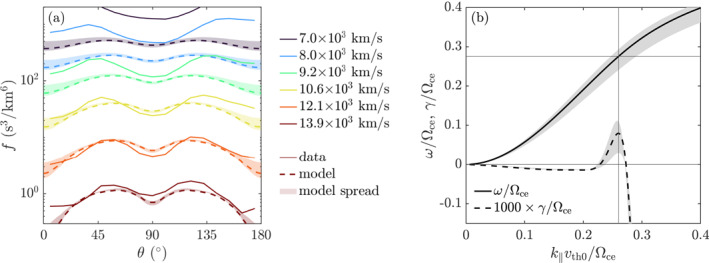
Figure 4.

WHAMP model and result. (a) Measured pitch‐angle distribution (solid) and model distribution (dashed). (b) Whistler‐mode frequency ω (solid) and growth rate γ (dashed). The shaded regions in both figures show variation in the input for the model distribution and the resulting range of frequencies and growth rate.
