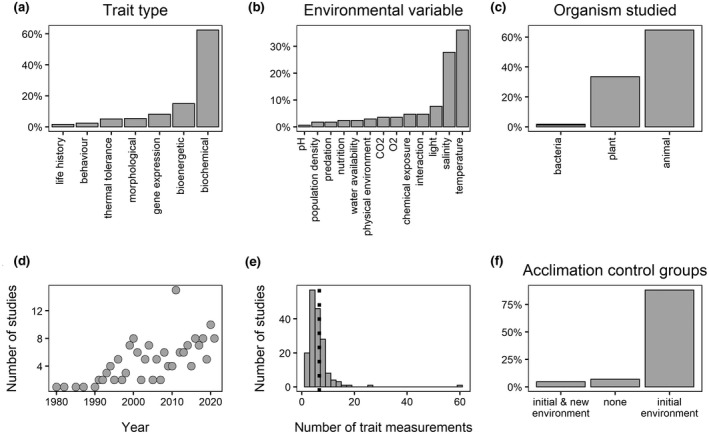
FIGURE 1.

(a) Proportion of all phenotypic traits measured when grouped by trait category. A total of 578 trait measurements were reported in the 170 studies reviewed. (b) Proportion of studies manipulating one of the 13 categories of environmental variables described in the supplementary text. Only one study, Becker et al. (2011) performed separate manipulations of two environmental variables and is excluded from this plot. (c) Proportion of studies (n = 170) implementing either bacteria, plant or animal species as the study organism. (d) Scatterplot showing number of empirical studies investigating the rates of phenotypic plasticity published per year since 1980. (e) Histogram showing the mean number of measurements of the phenotype made following the shift from the initial to the new environment (i.e., during the time course of acclimation). A mean value is presented for each of the 170 studies because in some cases data were reported on multiple phenotypic traits within the same study, of which the number of measurements performed during the time course of acclimation could vary from trait to trait. The dashed line indicates the overall mean. (f) Proportion of studies implementing either no control group, a control group acclimated to the ‘initial’ environment or two control groups, one acclimated to the ‘initial’ environmental state and one acclimated to the ‘new’ environmental state. A full description of this literature search is contained in the supplementary material. Data are available in the dryad digital repository (Burton et al., 2022).
