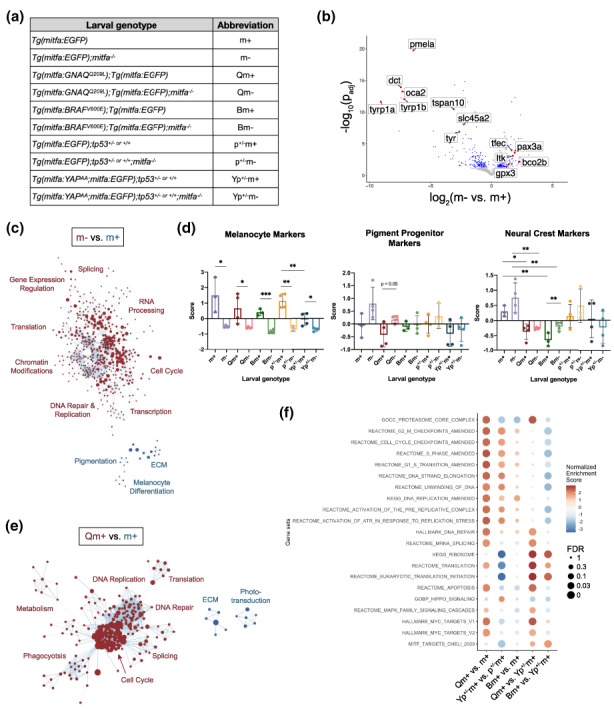
FIGURE 2.

mitfa deficiency and GNAQQ209L expression drive proliferation programs in larval zebrafish melanocyte lineage cells. (a) Larval genotypes and abbreviations used in bulk RNA‐sequencing of 5 dpf mitfa:GFP+ cells. mitfa −/− = mitfa w2/w2 . Samples labeled tp53 +/− (= tp53 +/M214K ) were all derived from an intercross of tp53 +/− and tp53 +/+ fish and thus are a 50:50 mix of these two genotypes. (b) Volcano plot depicting differentially expressed genes between m+ and m− larval cells. Statistically significant (adjusted p‐value < 0.05) genes in blue or red, statistically insignificant (adjusted p‐value > 0.05) in grey. (c) Cytoscape enrichment map depiction of re‐occurring differential cellular processes in m+ vs. m− larval cells, determined by Gene Set Enrichment Analysis (GSEA), filtered to FDR q‐value < 0.05 (full results in Table S2). Red are programs upregulated in m+, blue are programs up in m−. The circle size denotes the number of genes in each gene set, length of connecting line depicts the amount of gene set overlap. (d) Expression of neural crest lineage markers in larval melanocyte lineage cells; genotype abbreviations listed in (a). Data are presented as mean ± SD and statistical analyses determined by Student's unpaired t‐test. Left panel: Melanocyte marker expression. m+ vs. m− p = 0.0139*, Qm+ vs. Qm− p = 0.0398*, Bm+ vs. Bm− p = 0.0002***, p+/−m+ vs. p+/−m− p = 0.0015**, Yp+/−m+ vs. Yp+/−m− p = 0.0212*, Yp+/−m+ vs p+/−m+ p = 0.0081**. Middle panel: Pigment progenitor marker expression. Statistical analyses were determined by Student's unpaired t‐test. m+ vs. m− p = 0.1075, Qm+ vs. Qm− p = 0.0506 n.s. Right panel: Neural crest marker expression. m+ vs. m− p = 0.1953, Qm+ vs. m+ p = 0.0113*, Qm− vs. m− p = 0.006**, Bm+ vs. Bm− p = 0.0215*, Bm+ vs. m+ p = 0.0045**, Bm− vs. m− p = 0.0095**, Yp+/−m− vs p+/−m− p = 0.1394 n.s. (e) Cytoscape enrichment map depiction of re‐occurring differential cellular processes in Qm+ vs. m+ larvae, determined by Gene Set Enrichment Analysis (GSEA), filtered to FDR q‐value < 0.05 (full results in Table S2). Red are programs upregulated in Qm+, blue are programs upregulated in m+. The circle size denotes the number of genes in each gene set, length of connecting line depicts the amount of gene set overlap. (f) Dot plot summary of GSEA results of different pair‐wise comparisons from the Tg(mitfa:EGFP) larval RNA‐sequencing dataset. Color represents NES and dot size represents FDR (full results and amended gene lists in Table S2).
