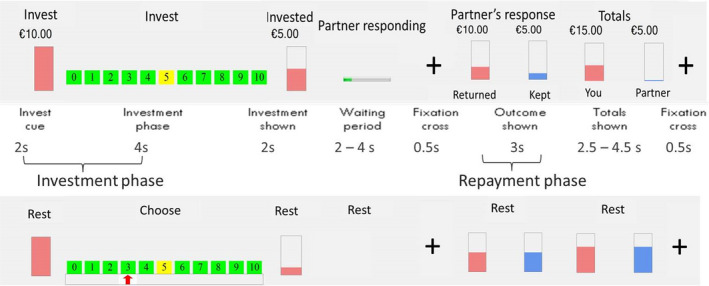
Figure 1.

Graphical overview of the trust game. Note. Top row represents the visual stimuli in the game trials; middle row are the separate phases of the trust game, including durations; bottom row represents the visual stimuli in the control trials. Printed with permission of Lemmers‐Jansen et al. (2017).
