
FIGURE 2.
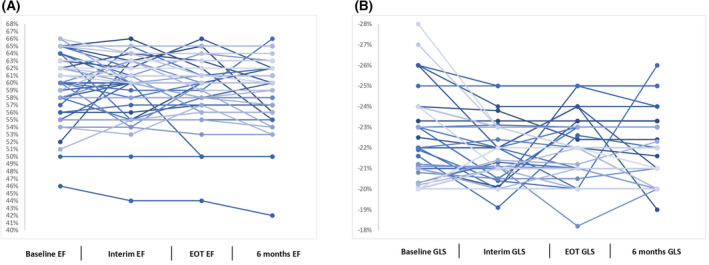
Percentage variations in left ventricular ejection fraction (EF) (A) and global systolic longitudinal myocardial strain (GLS) (B) throughout treatment up to 6 months after completion of study treatments expressed in individual values. EOT, end of treatment.