
Figure 2.
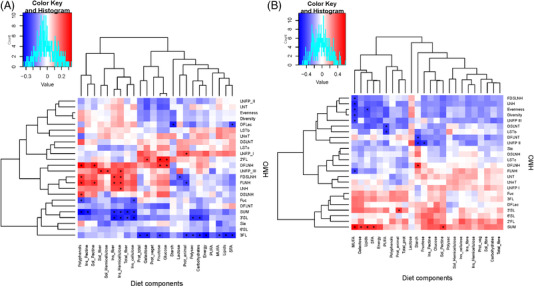
Specific maternal nutrients intakes were related to HMO concentrations in both secretor (A) and nonsecretor mothers (B). Heatmaps of Spearman correlations between HMO and dietary components intake during pregnancy. Significant correlations (p < 0.05) are marked by an asterisk (∗) and q‐values < 0.2. a‐. Blue squares represent negative correlations, whereas red squares show positive correlations.