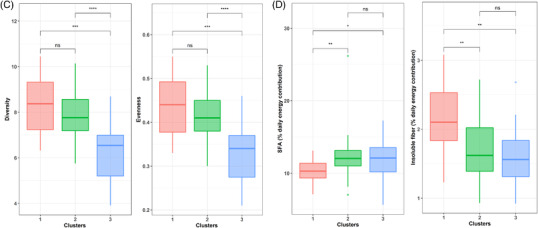
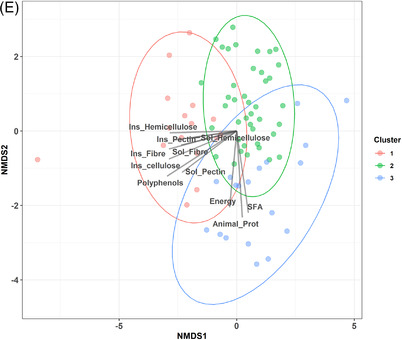
Figure 3.
Maternal diet during pregnancy impacts the HMO profile in secretor mothers. A) Polar plots visualizing the amount of variance of HMO profiles that could be explained by the nutrients analyzed using envFit function. The height of the bars reflects the amount of variance (R 2) explained by each covariate. Covariates are colored according to nutrient category. Asterisks indicate significant covariates (p < 0.05). B) Principal component analysis (PCA) showing the differences in the clusters of HMO. C, D) Boxplot indicating the differences in diversity and evenness (C) and the differences in maternal nutrient intake (in percentage of daily energy) according to clusters (D). E) Two dimensional nonmetric multidimensional scaling (NMDS) plot of HMO with the significant variables that impact the HMO profile.


