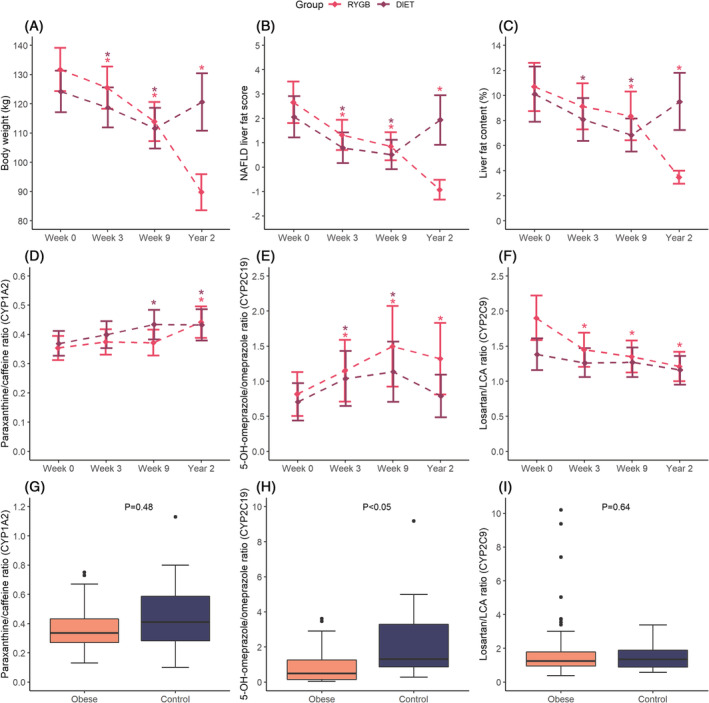
FIGURE 1.

Body weight, liver measures and metabolic ratios. Changes in (A) total body weighta, (B) NAFLD liver fat scorea, (C) liver fat contenta, (D) paraxanthine/caffeine ratioa,b, (E) 5‐OH‐omeprazole/omeprazole ratioa,b,c and (F) losartan/LCA ratioa,b in the RYGB and diet groups. Linear mixed‐effects models, with log‐transformed dependent variables, were used to estimate mean change over time compared with baseline. Data are presented as mean (95% CI). Boxplots of the (G) paraxanthine/caffeine ratio, (H) 5‐OH‐omeprazole/omeprazole ratio and (I) losartan/LCA ratiod in patients with severe obesity (n = 81) and controls (n = 18) at baseline. Student's t‐test on log‐transformed data was used to compare patients with obesity and controls at week 0. aStatistically significant differences (P < .05) within group (RYGB or diet) compared with baseline are symbolized by *. bPredicted values from the mixed‐effect model. cPatients with genotype CYP2C19 *2/*2 or *2/*4 were excluded from the plot. dDue to visualization purposes, one losartan/LCA ratio in the control group (49.05) was excluded from plot i. CYP, cytochrome P450; LCA, losartan carboxylic acid; NAFLD, nonalcoholic fatty liver disease; RYGB, Roux‐en‐Y gastric bypass
