
FIGURE 2.
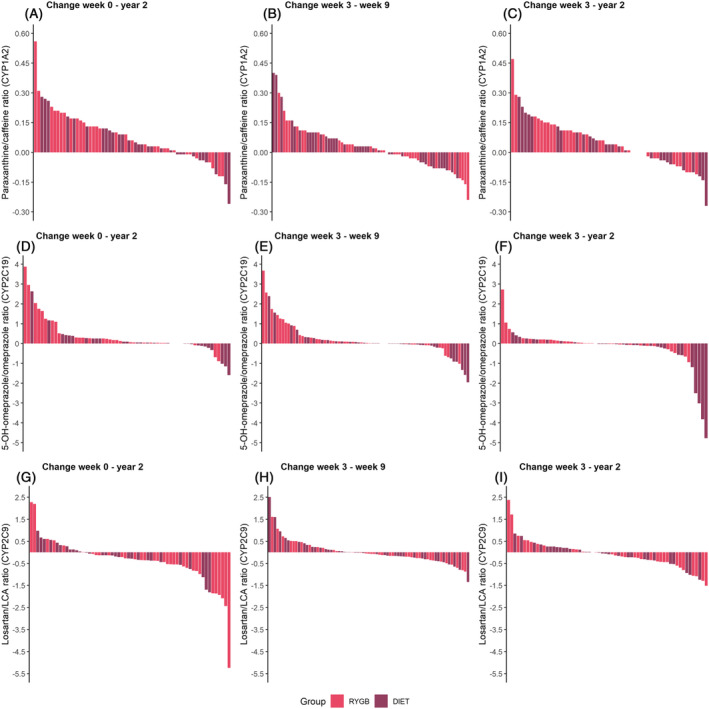
Individual variability in change in metabolic ratios between different study visits. Individual change in paraxanthine/caffeine ratio (CYP1A2) between (A) week 0 and year 2, (B) week 3 and week 9, and (C) week 3 and year 2 in 5‐OH‐omeprazole/omeprazole ratio (CYP2C19)a between (D) week 0 and year 2, (E) week 3 and week 9, and (F) week 3 and year 2, and losartan/LCA ratio (CYP2C9) between (G) week 0 and year 2, (H) week 3 and week 9, and (I) week 3 and year 2. Each bar represents the change within each patient. Note that the y axis range is different for each probe drug. aPatients with genotype CYP2C19 *2/*2 or *2/*4 were excluded from the plot. CYP, cytochrome P450; LCA, losartan carboxylic acid; RYGB, Roux‐en‐Y gastric bypass