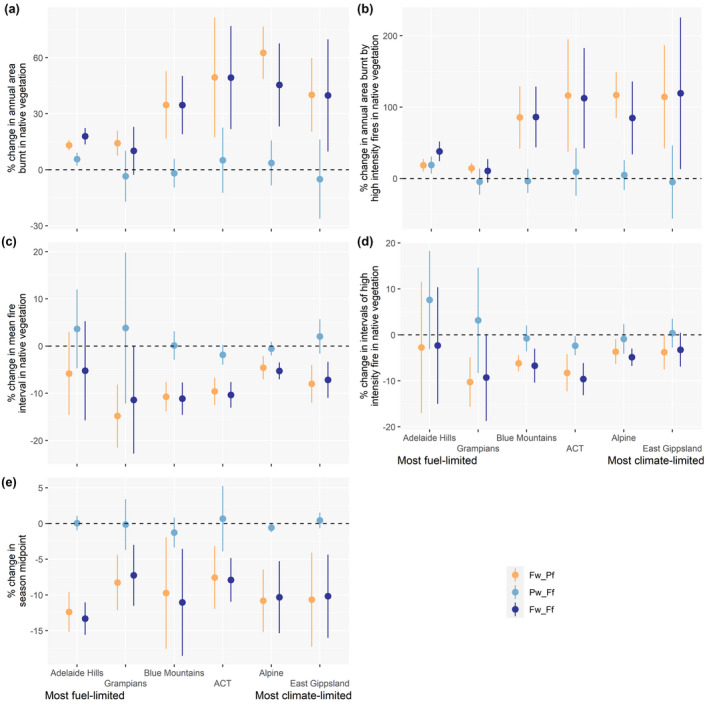
FIGURE 5.

Percent change from current conditions (present weather and present fuel, Pw_Pf) for each fire regime attribute by study area (n = 50 replicates × 100 years × 6 climate models). Study areas from left to right represent the most fuel‐limited to the most climate‐limited. Errors bars are SD around the mean. Yellow = future weather and present fuel, light blue = present weather and future fuel, dark blue = future weather and future fuel. (a) % change in native vegetation burnt annually, (b) % change in native vegetation burnt annually at high intensities, (c) % change in mean fire interval in native vegetation, (d) % change in mean high intensity fire interval in native vegetation, and (e) % change in season midpoint.
