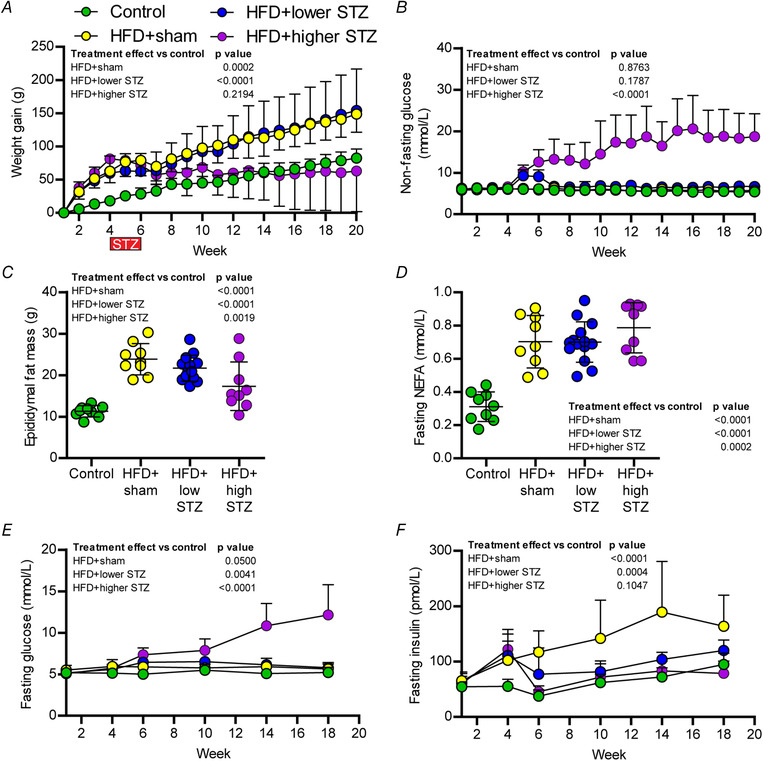
Figure 2. Combining a HFD with osmotic mini pump‐infused STZ induces long‐term, dose‐dependent effects on blood glucose and insulin concentrations at the same time as maintaining an obese phenotype.

A, average body weight gain. B, on‐fasting blood glucose concentration across the 20‐week time course. C, epididymal fat pat weight. D, fasting plasma non esterified fatty acids (NEFA) concentration at week 21. Fasting glucose and insulin concentrations were assessed prior to GTTs for weeks 1, 4, 6, 10, 14 and 18. Changes in fasting glucose and insulin across time between groups are shown in (E) and (F); data in all panels are the mean ± SD for n = 9 in control; n = 9 in HFD + sham; n = 13 in HFD + lower STZ; and n = 9 in HFD + higher STZ. Data in (C) and (D) are end‐point analysis represented as the mean ± SD; each point represents data from an individual animal. In (C) and (D), one‐way ANOVA with Student–Newman–Keuls post hoc was used to assess differences between groups. In (A), (B), (E) and (F), two‐way repeated measures ANOVA with Student–Newman–Keuls post hoc was used to analyse data. P values are main effects of treatment vs. the control group. Within and between group interactions are outlined in the Results section. [Colour figure can be viewed at wileyonlinelibrary.com]
