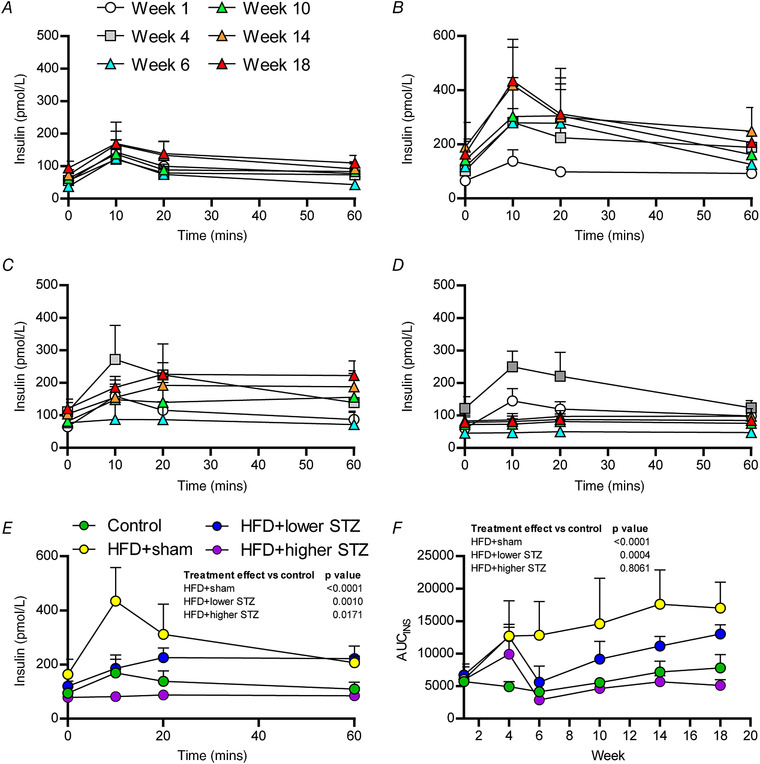
Figure 4. Combining a HFD with and osmotic mini pump‐infused STZ dose‐dependently alters insulin secretion in response to a GTT.

Plasma insulin was monitored over the first 60 min of each GTT (Fig. 3) and represents the insulin secretory capacity in response to a glucose load. Time course of plasma insulin changes during each GTT across the experimental period are shown for control (A), HFD + sham (B), HFD + lower STZ (C) and HFD + higher STZ (D). The plasma insulin response between groups at week 18 GTT is shown in (E) and represents the different groups relative insulin secretory capacity at the end of the study. The AUC for insulin (F) (AUCINS) was calculated from GTTs performed in weeks 0, 4, 6, 10, 14 and 18 in each group and plotted across the experimental time course. All data are shown as the mean ± SD for n = 9 in control; n = 9 in HFD + sham; n = 13 in HFD + lower STZ; and n = 9 in HFD + higher STZ. In (E) and (F), two‐way repeated measures ANOVA with Student–Newman–Keuls post hoc was used to analyse data. P values are main effects of treatment vs. the control group. Within and between group interactions are outlined in the Results section. [Colour figure can be viewed at wileyonlinelibrary.com]
