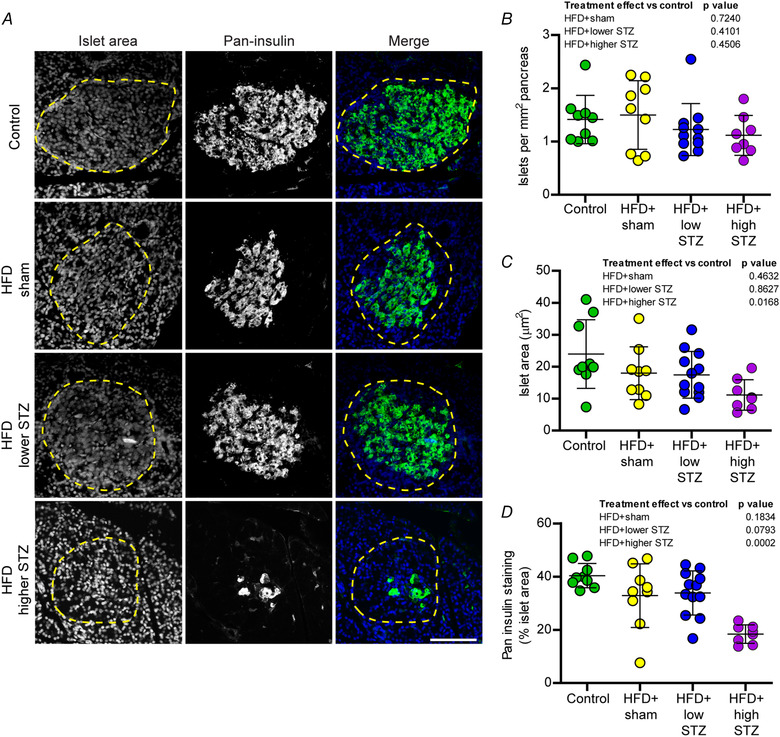
Figure 6. Combining a HFD and osmotic mini pump‐infused STZ model is mediated by a dose‐dependent reduction in pancreatic beta cell mass.

A, pancreatic sections were immunolabelled for pan‐insulin (green; labels proinsulin and insulin) and counterstained with DAPI to visualise nuclei, allowing identification of islets of Langerhans (dashed line). B, number of islets per mm2 of pancreas across the treatment groups. C, average islet area. D, percent of islet area with positive pan‐insulin immunoreactivity. Data are the mean ± SD; each point represents mean data from an individual animal. Scale bar = 50 μm. One‐way ANOVA with Student–Newman–Keuls post hoc was used to assess differences between groups. P values are main effects of treatment vs. the control group. [Colour figure can be viewed at wileyonlinelibrary.com]
