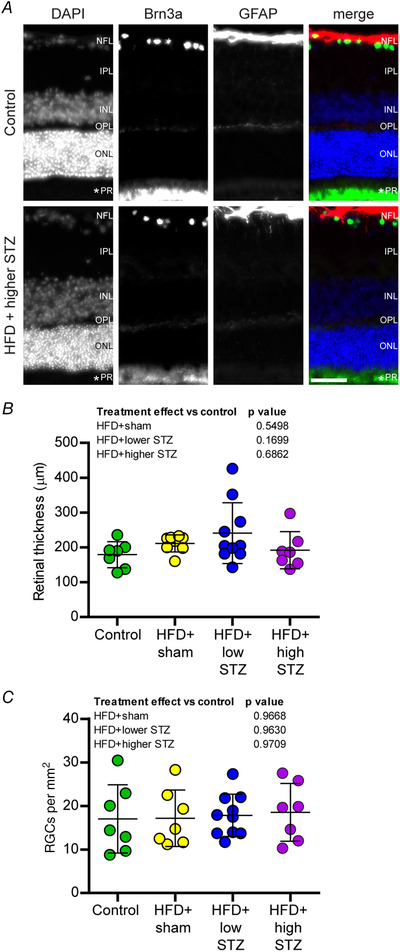
Figure 9. The HFD and osmotic mini pump‐infused STZ model does not exhibit signs of retinal degeneration.

A, retinas were cross‐sectioned and immunolabelled for retinal ganglion cells (RGCs, Brn3a, green), astrocytes (GFAP, red) and counterstained with DAPI to visualise nuclei and enable identification of retinal layers. NFL, nerve fibre and retinal ganglion cell (RGC) layer; IPL, inner plexiform layer; INL, inner nerve layer; OPL, outer plexiform layer; ONL, outer nerve layer; PR, photoreceptor layer. An asterisk (*) indicates inner/outer photoreceptor segment. B, total retinal thickness. C, number of RGCs per mm2. Data are the mean ± SD; each point represents mean data from an individual animal. Scale bar = 50 μm. One‐way ANOVA with Student–Newman–Keuls post hoc was used to assess differences between groups. P values are main effects of treatment vs. the control group. [Colour figure can be viewed at wileyonlinelibrary.com]
