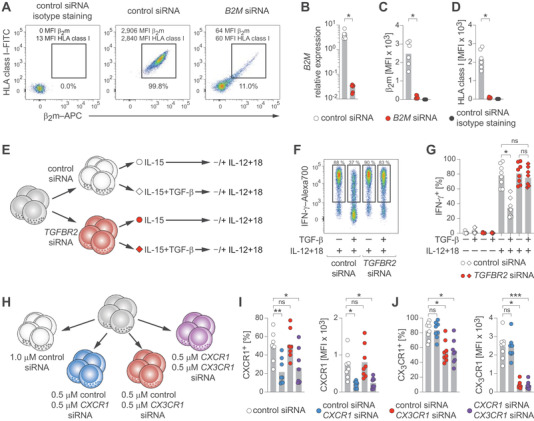
Figure 2.

Functional gene analyses in human NK cells. (A–D) NK cells were treated with control siRNA or B2M siRNA. (A) Representative β2m and HLA class I protein expression determined by flow cytometry after the indicated treatments. (B) Summary of B2M mRNA expression relative to GAPDH as determined by RT‐qPCR. (C) Summary of β2m protein expression as MFI measured by flow cytometry. (D) Summary of HLA class I protein expression as MFI measured by flow cytometry. (E–G) NK cells were treated with control siRNA or TGFBR2 siRNA, exposed or not to TGF‐β, and stimulated with IL‐12 and IL‐18. (E) Experimental setup. (F) Representative IFN‐γ expression after the indicated treatments as determined by flow cytometry. (G) Summary of IFN‐γ expression. (H–J) NK cells were treated with control siRNA or with the indicated combinations of control siRNA, CXCR1 siRNA, and CX3CR1 siRNA and protein expression was analyzed by flow cytometry. (H) Treatment setup. (I) Summaries of CXCR1 expression. Left: frequency. Right: MFI. (J) Summaries of CX3CR1 expression. Left: frequency. Right: MFI. Data are displayed as mean and individual datapoints (B‐D, G, I, J) and representative of n = 6 donors in three independent experiments (A) and n = 8 donors in three independent experiments (F) or pooled from n = 6 donors in two independent experiments (B–D) and n = 8 donors in three independent experiments (G, I, J). Symbols represent individual donors (B–D, G, I, J). Statistical significance was tested using Wilcoxon test (B–D) or Friedman test with Dunn's test (G, I, J). *p < 0.05, **p < 0.01, ***p < 0.001.
