
FIGURE 1.
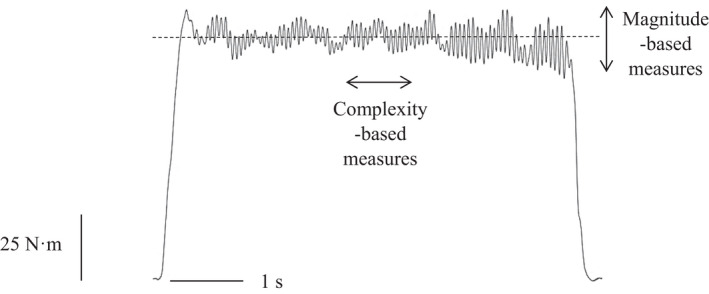
Raw force output from an isometric knee extension contraction performed at 40% of participants' maximal voluntary contraction (MVC). Note the constant fluctuations above and below the imposed target. These fluctuations have typically been quantified according to their magnitude, using measures such as the standard deviation and coefficient of variation (which, in this case are 3.9 N·m and 3.9%, respectively), and more recently according to their temporal structure, using complexity‐based measures such as approximate entropy, sample entropy and detrended fluctuation analysis α (which, in this case are 0.58, 0.54 and 1.16, respectively)