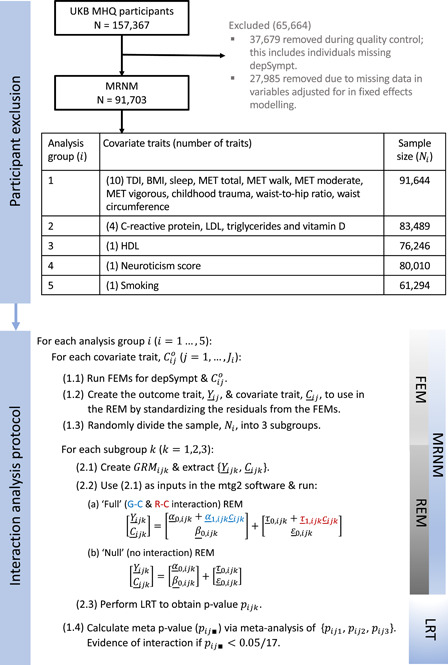
Figure 1.

Methods flowchart for UK Biobank: participant exclusion, analysis groupings and scheme for interaction analysis. FEM, fixed effects model; LRT, likelihood ratio test; REM, random effects model; G–C, genotype‐covariate; MRNM, multivariate reaction norm model; R–C, residual‐covariate; , sample size for analysis group i, subgroup ; (), vector of length () containing the standardised residual covariate trait from analysis group (and subgroup ); (), vector of length () containing the standardised residual outcome trait for interaction analysis with (); (), random effects vector of length representing the contribution to the outcome (covariate) trait for each individual from the homogeneous polygenic component; (), random effects vector of length representing the contribution to the outcome (covariate) trait for each individual from the homogeneous residual component; (), random effects vector of length representing the contribution to the outcome trait for each individual due to G–C (R–C) interaction
