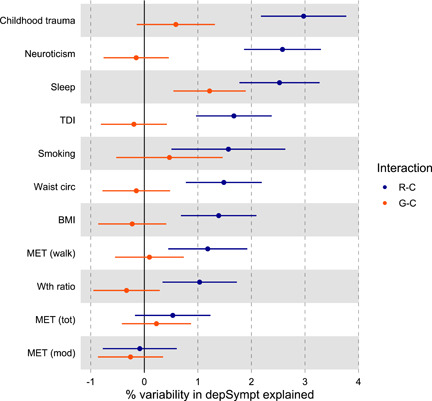
Figure 2.

The percentage of variation in depSympta attributable to the G–C (genotype‐covariate) interaction (red) and the R–C (residual‐covariate) interaction (blue) with 95% confidence intervalsb. aAdjusted for age, sex, genetic batch and PCs 1 to 15 (SM section 1.4.4 provides details for producing interaction variance component estimates and standard errors on this scale). bWhen the 95% CI for a G–C interaction variance component excludes zero, there is evidence that the covariate trait modulates polygenic effects on depSympt. When the 95% CI for an R–C interaction variance component excludes zero, there is evidence that the covariate trait can explain further variability in depSympt, in addition to that specified by the full MRNM
