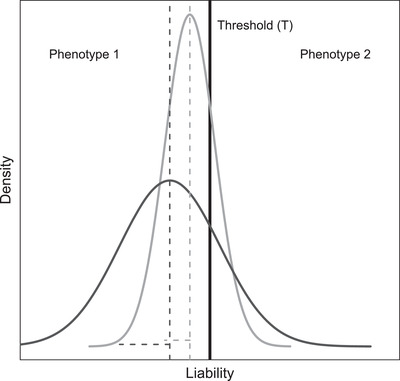
Figure 2.

Basic concept of a threshold trait. Individuals have liabilities (x‐axis) comprising genetic and environmental effects that translate into expression of phenotype 2 versus phenotype 1 when above versus below the threshold (T, black vertical line), generating an intrinsically nonlinear genotype‐phenotype map. Dark and light gray curves show hypothetical distributions of liabilities for two populations or groups (which could be sexes) with the same number of individuals in each group (i.e., same area under each curve). The mean (vertical dashed lines) and standard deviation (horizontal dashed lines) of the liability distributions both differ between the two groups (the dark gray group has a lower mean and greater standard deviation and hence greater variance). Nevertheless, the proportion of individuals who expresses phenotype 2 (i.e., the relative area under each curve that exceeds the threshold), and hence the mean phenotype, is the same for both groups (0.21 in the depicted example). Hence, sexual dimorphism in mean liability will not necessarily translate into sexual dimorphism in observed phenotype. Mathematical treatments are in Supporting Information S1
