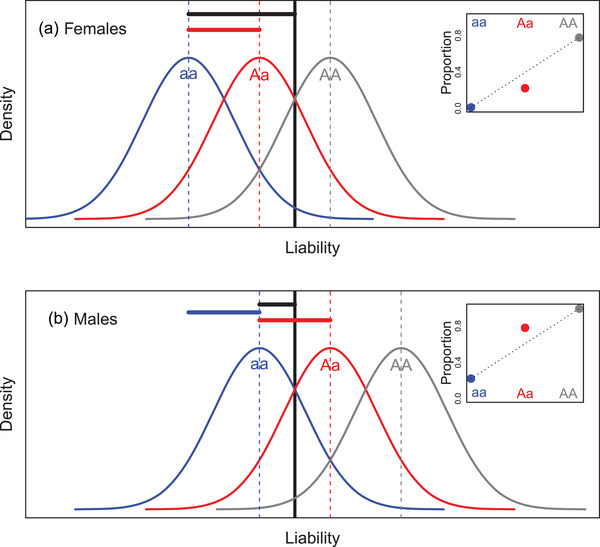
Figure 3.

Illustration of emergence of (partial) sex‐specific dominance reversal (SSDR) in a threshold trait with sexual dimorphism in mean baseline liability and a large‐effect locus with purely additive allelic effects on liability. Blue and gray curves show the population‐wide distributions of liabilities for the two alternative homozygotes at the large‐effect locus (aa and AA, assuming an additional polygenic architecture) in (A) females and (B) males. Red curves show the population‐wide distributions of liabilities for the heterozygotes (Aa), assuming additive effects of the alternative alleles (i.e., codominance) on the liability scale that are the same in both sexes. The black vertical line denotes the threshold, above which the alternative phenotype is expressed. Accordingly, inset panels show the proportions of individuals of each homozygote (blue and gray) and the heterozygote (red) that express the alternative phenotype. Dotted lines link the proportions for the two homozygotes, visualizing that the proportions for the heterozygotes lie below versus above the additive expectations in females versus males, constituting SSDR (e.g., Fig. 1). In the main figures, vertical dashed lines denote mean liabilities. Black horizontal lines denote the distances from each sex‐specific mean for the lower homozygote (i.e., blue vertical line) to the threshold. The blue horizontal line highlights the degree of sexual dimorphism in mean liability (i.e., distance between the blue vertical lines for males versus females). Red horizontal lines highlight the additive effect of the alternative allele at the large‐effect locus (here, the same in both sexes). Illustrated liability distributions are Gaussian, but this is not essential to generate SSDRs (Supporting Information S3). Parameter values for the illustrated example are shown in Supporting Information S2
