
Fig. 1.
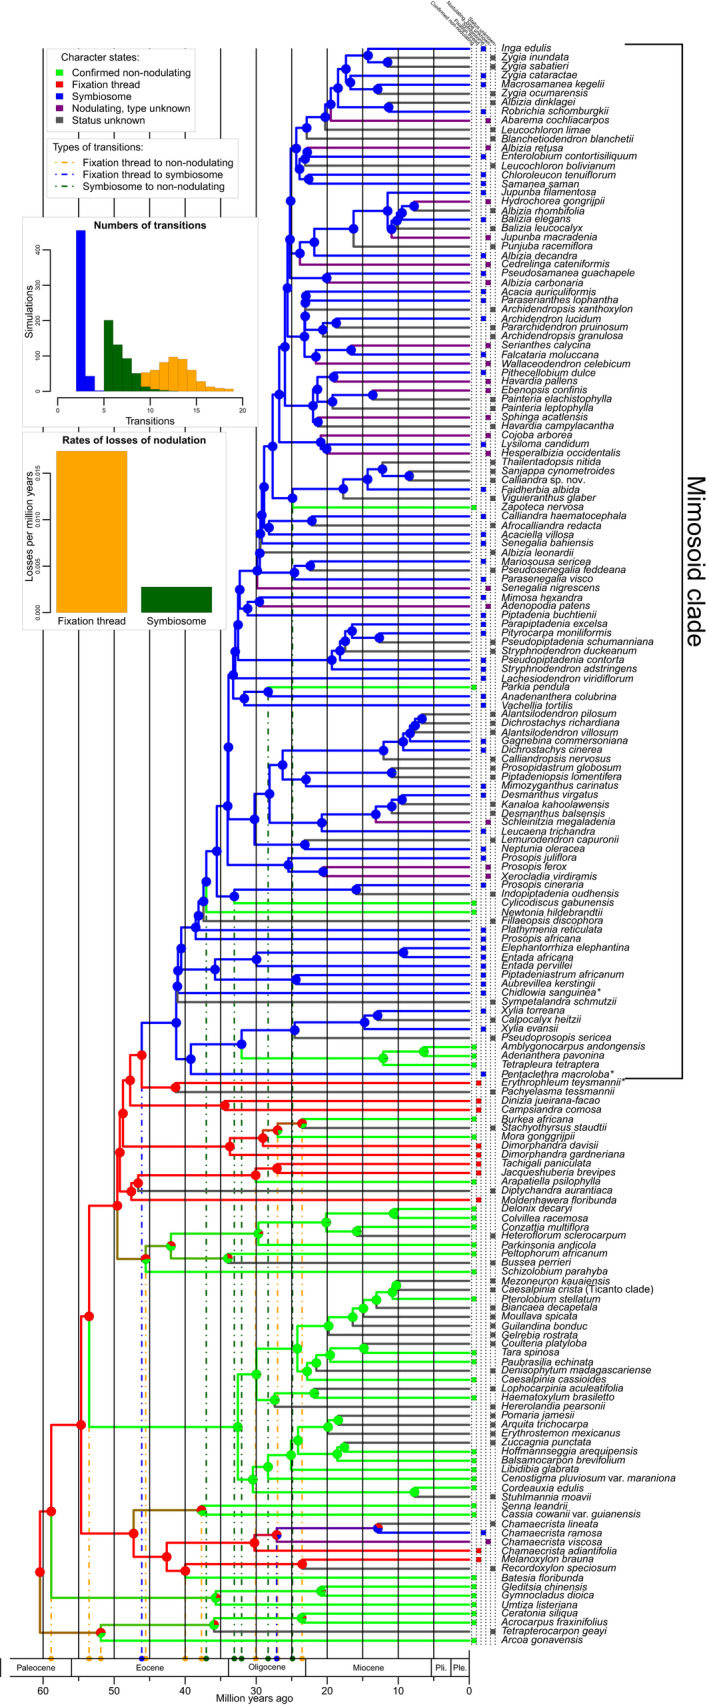
Evolutionary trajectories of nodulation and nodule type across a time‐calibrated phylogeny of the legume subfamily Caesalpinioideae. Pie charts on nodes show the proportions of the most probable reconstructed character states: nonnodulating, fixation thread (FT‐type nodules), symbiosome (SYM‐type nodules), nodulating but of unknown type, and nodulation status unknown, summarized over 500 simulations. Branch colours denote the nodulation status of the node or tip it subtends and the coloured boxes in front of each taxon name show the character state for that species. Note that in three clades (the Senna + Cassia clade, the Arcoa + Acrocarpus clade and the Peltophorum clade) ‘double’ losses of FT‐type nodules are inferred to have occurred simultaneously in both descendant lineages of that node. For example, the crown node of the Senna + Cassia clade is inferred to be nodulating with FT‐type nodules even though Senna and Cassia are nonnodulating. The dashed orange, blue and dark green vertical lines show the phylogenetic locations and maximum ages of the various character state transitions on the tree. Using the same colours, the histograms show the frequencies of the number of transitions from FT to SYM (blue), from SYM to nonnodulation (green) and from FT to nonnodulation (orange), and the rates of losses of nodulation per million years for SYM to nonnodulation (green) and FT to nonnodulation (orange) across 500 independent character estimations. Note that while the three other character state transitions, from nonnodulating to FT or SYM‐type nodules, and from SYM to FT, were not allowed under our model, and were therefore fixed at zero, an alternative model permitting all character state transitions gave an identical result (Supporting Information Fig. S3). Asterisks after terminal names indicate species which are the focus of detailed nodule anatomical work presented in Figs 2, 3, 4. Ple, Pleistocene; Pli, Pliocene.